. 2010 Nov;7(11):1686-94.
doi: 10.1016/j.hrthm.2010.06.032. Epub 2010 Jul 3.

Calcium oscillations and T-wave lability precede ventricular arrhythmias in acquired long QT type 2

Affiliations

Calcium oscillations and T-wave lability precede ventricular arrhythmias in acquired long QT type 2

Jan Němec et al. Heart Rhythm. 2010 Nov.

Abstract

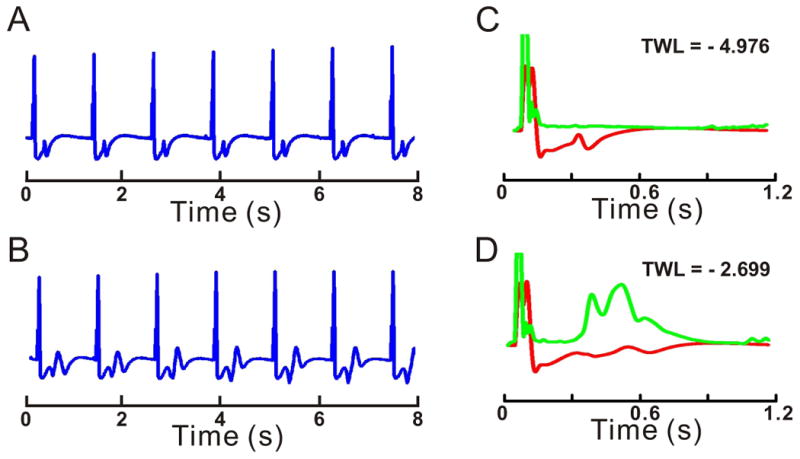
Background: Alternans of intracellular Ca(2+) (Ca(i)) underlies T-wave alternans, a predictor of cardiac arrhythmias. A related phenomenon, T-wave lability (TWL), precedes torsades de pointes (TdP) in patients and animal models with impaired repolarization. However, the role of Ca(i) in TWL remains unexplored.

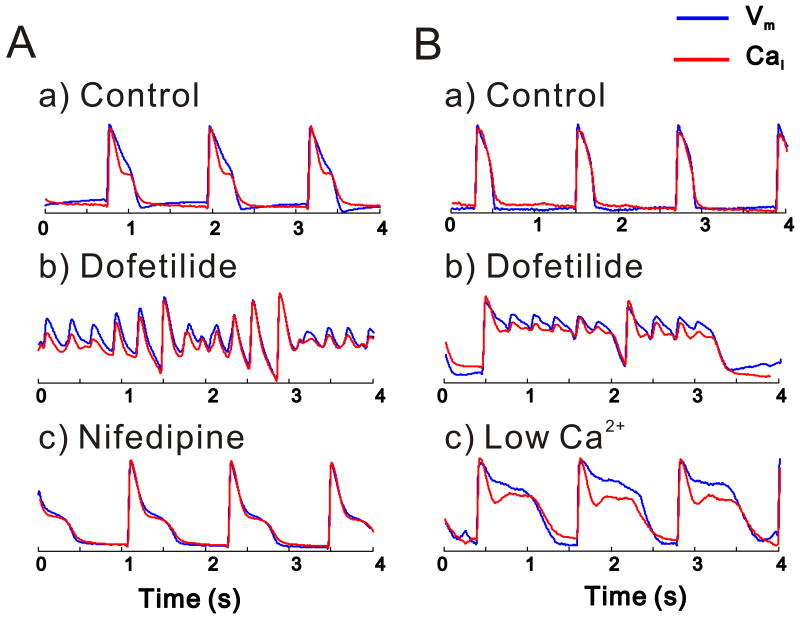
Objective: This study investigated the role of Ca(i) dynamics on TWL in a noncryoablated rabbit model of long QT syndrome type 2 (LQT2) using simultaneous measurements of Ca(i) transient (CaT), action potentials (APs), and electrocardiogram (ECG) during paced rhythms and focused on events that precede ventricular ectopy.

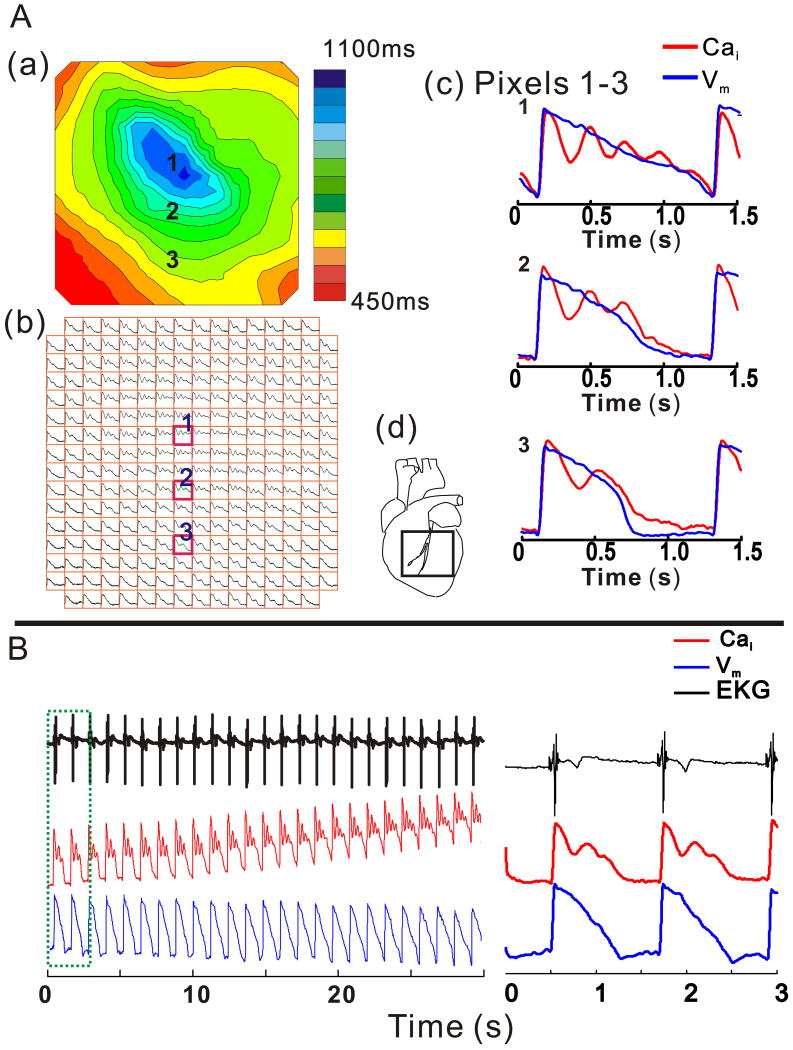
Methods: APs and CaTs were mapped optically from paced Langendorff female rabbit hearts (n = 8) at 1.2-s cycle length, after atrioventricular node ablation. Hearts were perfused with normal Tyrode solution, then with dofetilide (0.5 μM), and reduced [K(+)] (2 mM) and [Mg(2+)] (0.5 mM) to elicit LQT2. Lability of ECG, voltage, and Ca(i) signals were evaluated during regular paced rhythm, before and after dofetilide perfusion.

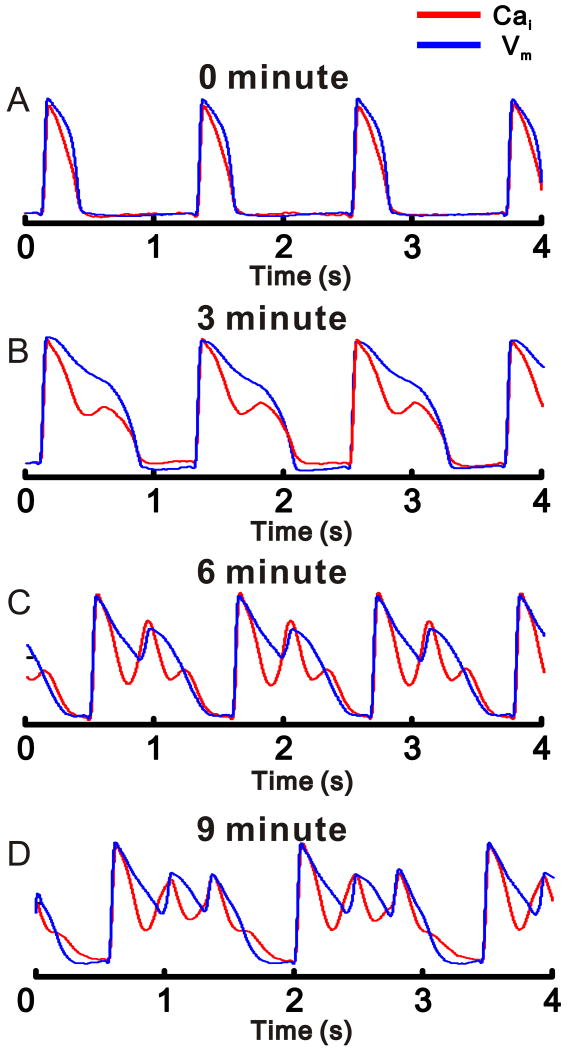
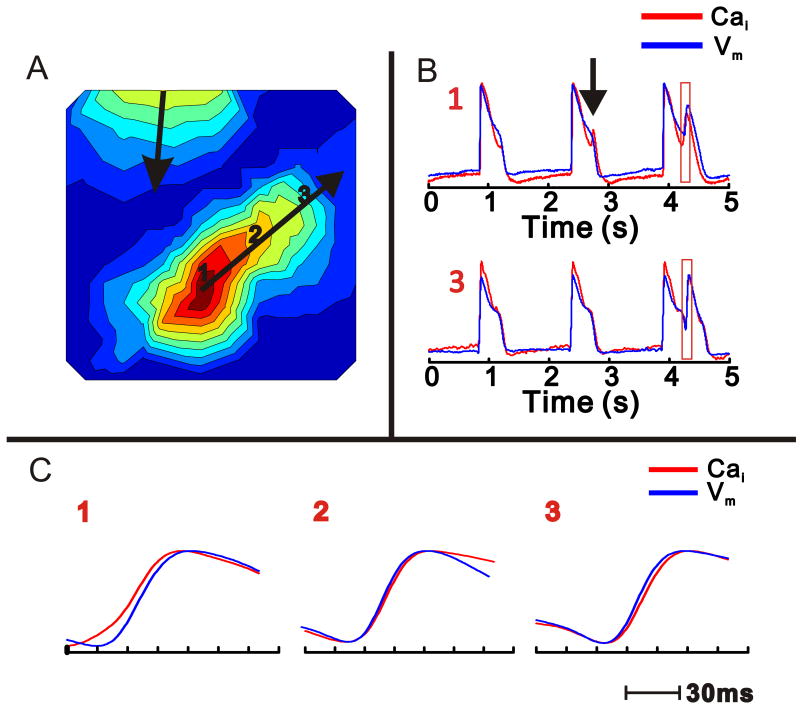
Results: In LQT2, lability of Ca(i), voltage, and ECG signals increased during paced rhythm, before the appearance of early afterdepolarizations (EADs). LQT2 resulted in AP prolongation and multiple (1 to 3) additional Ca(i) upstrokes, whereas APs remained monophasic. When EADs appeared, Ca(i) rose before voltage upstrokes at the origins of propagating EADs. Interventions (i.e., ryanodine and thapsigargin, n = 3 or low [Ca](o) and nifedipine, n = 4) that suppressed Ca(i) oscillations also abolished EADs.

Conclusion: In LQT2, Ca(i) oscillations (Ca(i)O) precede EADs by minutes, indicating that they result from spontaneous sarcoplasmic reticulum Ca(2+) release rather than spontaneous I(Ca,L) reactivation. Ca(i)O likely produce oscillations of Na/Ca exchange current, I(NCX). Depolarizing I(NCX) during the AP plateau contributes to the generation of EADs by reactivating Ca(2+) channels that have recovered from inactivation. TWL reflects CaTs and APs lability that occur before EADs and TdP.


Conflict of interest statement

Disclosures: The authors have no conflicts to disclose

Figures

Figure 1
Figure 1
Prolonged repolarization induces TWL Examples of EKG recordings during pacing at 50 beats per min: (A) Control and (B) LQT2. T-wave morphology is constant in A, but changes on a beat-to-beat basis in B. EKG lability (green traces) is plotted before (C) and during LQT2 (D) and is superimposed on signal-averaged EKG (red traces). The Y-axis for lability is expanded 10-fold with respect to signal-averaged EKG. TWL is calculated as the logarithm of maximum EKG lability measured during the repolarization phase and normalized with respect to the amplitude of signal-averaged QRS. TWL is essentially absent in C and highly pronounced in D. Maximum lability occurs at ∼470 ms after the pacing stimulus in this case.
Figure 2
Figure 2
CaiO precede EADs Simultaneous recordings of Vm (blue) and Cai (red) before (A) and during LQT2 (B,C). A: Vm and Cai are shown at slow (top) and fast (bottom) sweep speeds and both exhibit monophasic time-courses. B: Vm and Cai are shown at slow (top) and fast (bottom) sweep speeds. In the first 2 APs, LQT2 condition prolonged APD and elicited Cai oscillations during the paced beats with no Vm instabilities. The 3rd AP exhibited multiple Cai peaks which were occasionally coincident with EADs. C: An example of TdP onset following the 5th paced beat. The EKG (top trace) and the optical traces of Vm and Cai (bottom traces) were recorded simultaneously. The CaiO precede the first EADs at this site.
Figure 3
Figure 3
Time-dependent oscillations of Cai and the evolution of EADs Vm (blue) and Cai (red) measurements (left) during pacing (A, B) and ventricular escape rhythms (C, D) and the corresponding phase-plots (right). A. In control, Vm and Cai are monophasic and similar in shape. B: LQT2 for 3 min, a 2nd rise of Cai appears during the AP plateau while Vm remains free of EADs. C: LQT2 for 6 min promotes more complex CaiO that are associated with a single EAD. In this pixel, the Cai upstroke precedes the Vm upstroke. D: LQT2 for 9 min, 2 consecutive EADs follow each AP upstroke. Prominent Cai upstrokes precede EAD upstrokes.
Figure 4
Figure 4
Spatial and temporal heterogeneity of CaT and APs during LQT2 A: Isochronal Map of APD90 (A (a), top left) from the anterior surface in LQT2; the field-of-view of the array is shown (see inset d) and isochronal lines are 50 ms apart (see color scale). Cai signals recorded at each site are depicted in the symbolic map of the photodiode array (b). Simultaneous Vm and Cai from a single-beat are superimposed for pixels labeled 1, 2 and 3 on the maps and are shown at fast sweep speed (c). Marked spatial heterogeneities of CaiO appear; with the highest number of CaiO found at sites with the longest APDs and decrease in going to sites with shorter APDs. B: EKG, Vm and Cai recordings from pixel (1) for 30 s show a gradual APD prolongation associated with an increasing number of CaiO and a rise of diastolic Cai. The right panel shows a shorter segment of the signals (in green box on left) with better time resolution.
Figure 5
Figure 5
Propagation of Vm and Cai upstrokes during an EAD A: Isochronal activation map of an ectopic beat (EAD) occurring during an escape rhythm. The origin of the EAD is at site 1. Isochronal lines are 3 ms apart. Note that another independent wavefront emanates from the base of the heart. B: Vm and Cai tracings from sites: 1 and 3 in (A). The 1rst AP and CaT are monophasic at site 1; during the 2nd AP, there is a distinct 2nd Cai peak without an EAD (arrow). On the 3rd beat, an EAD appears with sufficient magnitude to propagate, as in A. C: The temporal relationship between Cai and Vm signals are shown at higher resolution at sites 1-3 as labeled in A. At the site of EAD origin (1), Cai upstroke precedes Vm upstroke (8 ms); at site 2, Vm is coincident with Cai and at site 3, remote from the EAD origin, Vm precedes Cai (3 ms).
Figure 6
Figure 6
EKG recordings of complex ectopy: Bigeminy and Trigeminy correspond to CaiO A: EKG recording of paced rhythm with bigeminy. Each paced beat (green arrows) is followed by a ventricular ectopic beat (red arrow). T-waves on EKG signals are indicated by black arrows. Note that neither Vm nor Cai recover to baseline before the ectopic beat; in this sense, the paced/ectopic beat can be understood as a single complex AP. B: An episode of trigeminy from the same experiment. Two paced beats are followed by an ectopic beat. The optical tracings indicate that alternans between a short monophasic paced AP and a “bigeminal” AP underlies the trigeminal pattern. C: Simultaneous EKG and Cai tracing with brief runs of polymorphic VT. Pacing rate was 50 bpm with 2:1 capture. Each run of polymorphic VT corresponds to a single CaT with multiple secondary CaiO.
Figure 7
Figure 7
Effect of Reduced SR Ca2+ load on CaiO and TdP TdP was induced with LQT2 solution then nifedipine (5 μM) was added (A) or external Ca2+ was lowered (100 μM) (B) in the perfusate. Both interventions attenuated CaiO and terminated TdP despite continuous dofetilide perfusion and marked APD prolongation.

Comment in

Similar articles

Cited by

References

    1. Malik M, Batchvarov VN. Measurement, interpretation and clinical potential of QT dispersion. The Journal of the American College of Cardiology. 2000;36:1749–1766. - PubMed
    1. Hinterseer M, Beckmann BM, Thomsen MB, et al. Relation of increased short-term variability of QT interval to congenital long-QT syndrome. Am J Cardiol. 2009;103:1244–1248. - PubMed
    1. Morita H, Wu J, Zipes DP. The QT syndromes: long and short. Lancet. 2008;372:750–763. - PubMed
    1. January CT, Fozzard HA. Delayed afterdepolarizations in heart muscle: mechanisms and relevance. Pharmacological Reviews. 1988;40:219–227. - PubMed
    1. Volders PG, Vos MA, Szabo B, et al. Progress in the understanding of cardiac early afterdepolarizations and torsades de pointes: time to revise current concepts. Cardiovascular Research. 2000;46:376–392. - PubMed

Publication types