Review
. 2011 May;105(3):162-79.
doi: 10.1016/j.pbiomolbio.2010.06.001. Epub 2010 Jun 25.

Calcium indicators and calcium signalling in skeletal muscle fibres during excitation-contraction coupling

Affiliations
Review

Calcium indicators and calcium signalling in skeletal muscle fibres during excitation-contraction coupling

Stephen M Baylor et al. Prog Biophys Mol Biol. 2011 May.

Abstract

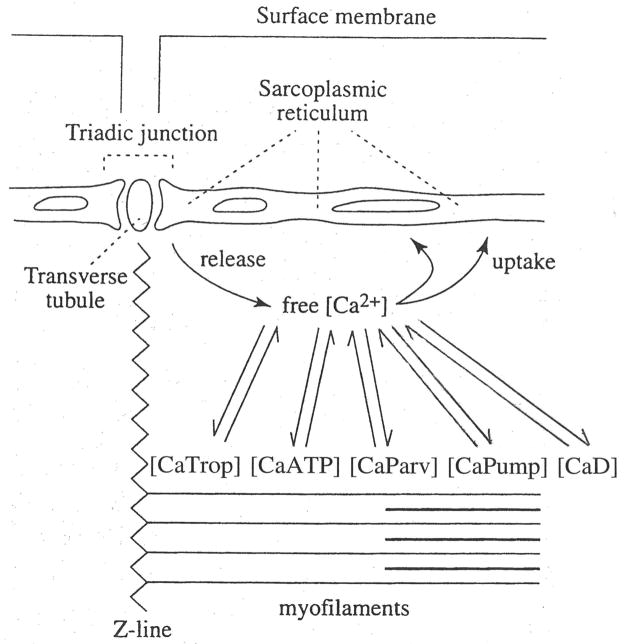
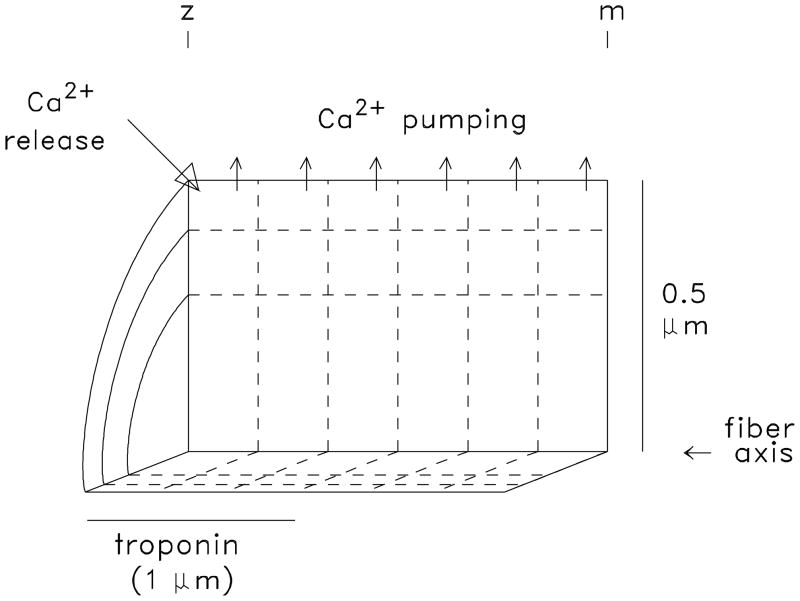
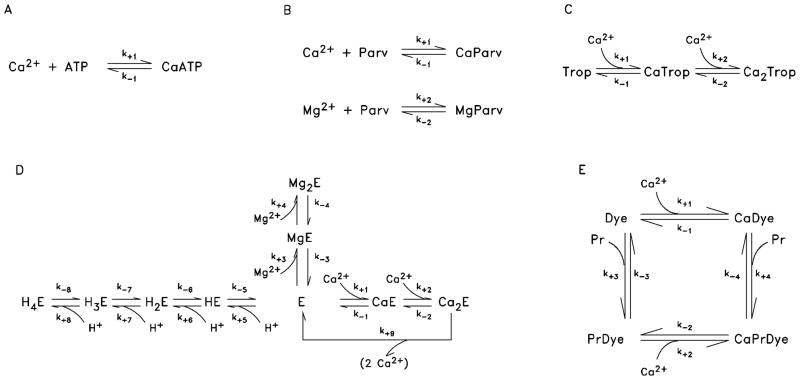
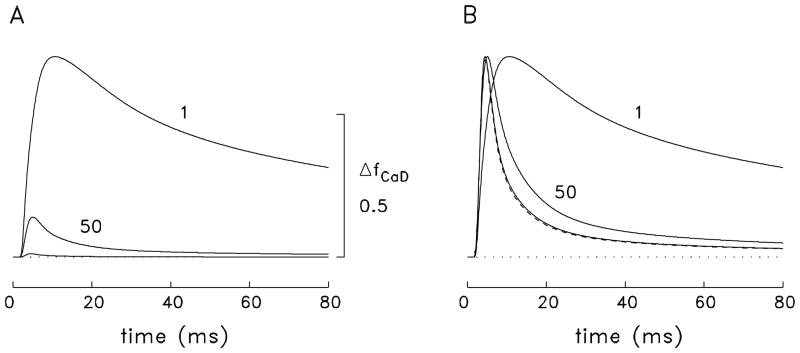
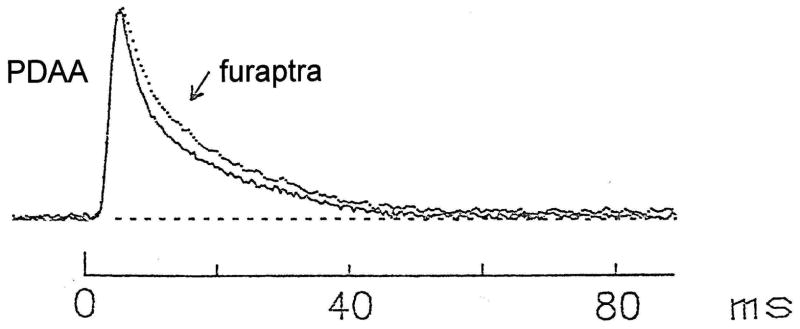
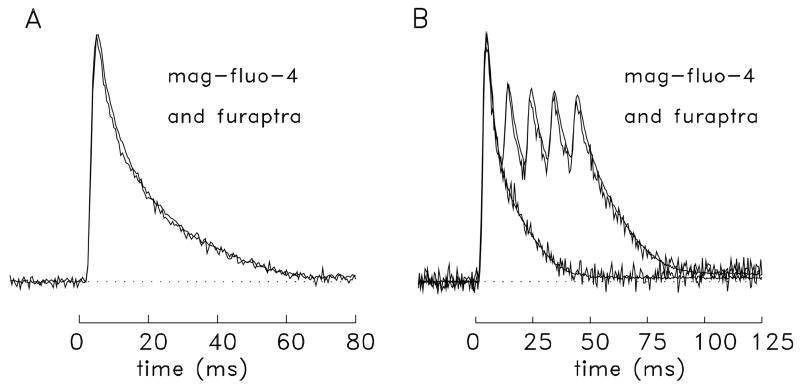
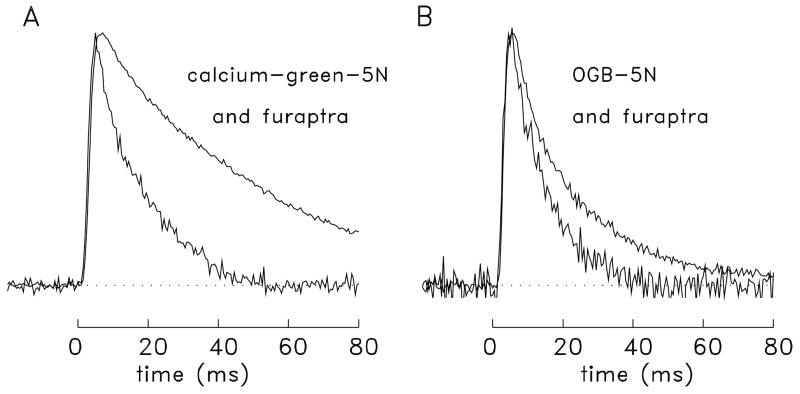
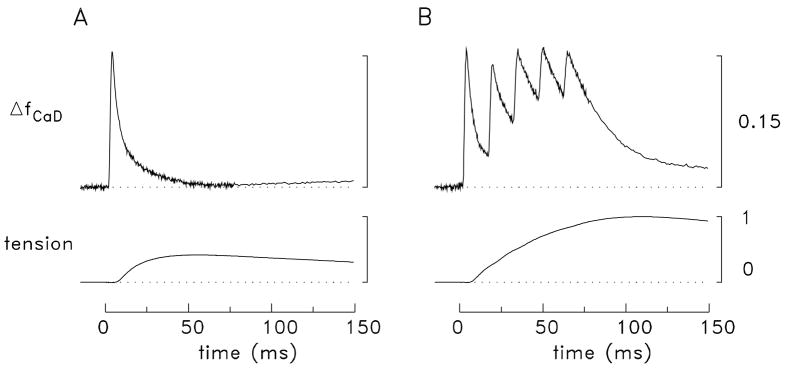
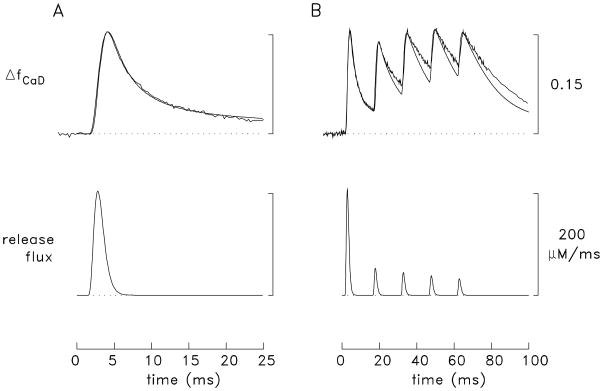
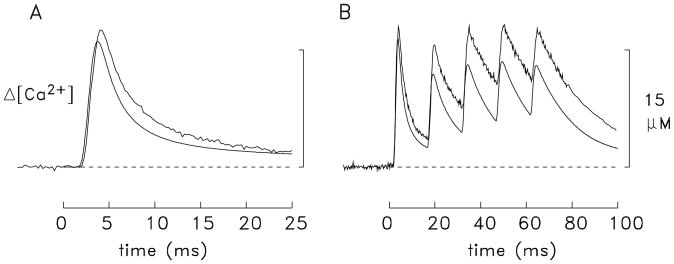
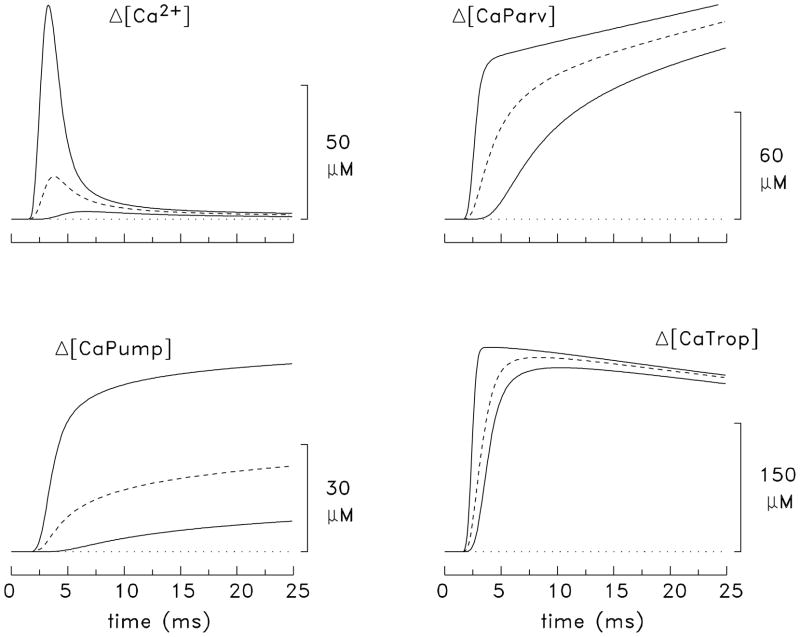
During excitation-contraction coupling in skeletal muscle, calcium ions are released into the myoplasm by the sarcoplasmic reticulum (SR) in response to depolarization of the fibre's exterior membranes. Ca(2+) then diffuses to the thin filaments, where Ca(2+) binds to the Ca(2+) regulatory sites on troponin to activate muscle contraction. Quantitative studies of these events in intact muscle preparations have relied heavily on Ca(2+)-indicator dyes to measure the change in the spatially-averaged myoplasmic free Ca(2+) concentration (Δ[Ca(2+)]) that results from the release of SR Ca(2+). In normal fibres stimulated by an action potential, Δ[Ca(2+)] is large and brief, requiring that an accurate measurement of Δ[Ca(2+)] be made with a low-affinity rapidly-responding indicator. Some low-affinity Ca(2+) indicators monitor Δ[Ca(2+)] much more accurately than others, however, as reviewed here in measurements in frog twitch fibres with sixteen low-affinity indicators. This article also examines measurements and simulations of Δ[Ca(2+)] in mouse fast-twitch fibres. The simulations use a multi-compartment model of the sarcomere that takes into account Ca(2+)'s release from the SR, its diffusion and binding within the myoplasm, and its re-sequestration by the SR Ca(2+) pump. The simulations are quantitatively consistent with the measurements and appear to provide a satisfactory picture of the underlying Ca(2+) movements.


Figures

Fig. 1
Fig. 1
Schematic of a portion of a frog skeletal muscle fibre. The arrows indicate the intracellular movement of Ca2+ during excitation-contraction coupling: release from the SR at the triadic junction, binding and diffusion within the myoplasm, and reuptake into the SR. [CaTrop], [CaATP], [CaParv], and [CaPump] denote the concentrations of Ca2+ bound to the major myoplasmic Ca2+ buffers (troponin, ATP, parvalbumin, and the SR Ca2+ pump). [CaD] denotes the concentration of Ca2+ bound to an indicator dye introduced into myoplasm to measure free [Ca2+].
Fig. 2
Fig. 2
In vitro absorbance spectra of furaptra (A and C) and mag-fluo-4 (B and D). A) Squares: absolute spectra measured in zero and 10 mM Ca2+; curves: best-fitted spectra for zero and saturating Ca2+ based on these and other data (not shown). 30 μM furaptra; pH 7.0; 18 °C. B) Squares: absolute spectra measured in 0 and 0.24 mM [Ca2+]; curves: best fitted spectra for 0 and saturating Ca2+ based on these and other data. 9 μM mag-fluo-4; pH 7.0; 21°C. C) and D) Difference spectra due to Ca2+ binding from A and B, respectively. All spectra were measured in a buffered KCl solution (0.15 M ionic strength); the cuvette path length was 1 cm.
Fig. 3
Fig. 3
Schematic view of one-fourth of a half sarcomere of one myofibril showing the arrangement of the 18 equal-volume compartments (6 longitudinal × 3 radial) in the multi-compartment model of the myoplasm used for frog fibres (Baylor and Hollingworth, 1998). SR Ca2+ release enters the half sarcomere in the outermost compartment nearest the z-line (large downward arrow). Ca2+ pump activity occurs within all compartments in the outer row (small upward arrows); troponin is restricted to the nine compartments located within 1 μm of the z-line (the region containing thin filaments, average length ~1 μm). The other buffers (ATP, parvalbumin, furaptra) are diffusible and therefore have access to all compartments. Because the buffer concentrations in Table 3 are average values for the entire myoplasmic volume, the actual concentrations of troponin and Ca2+ pump molecules in the relevant compartments are 2.0 and 3.0, respectively, times the values listed in Table 3.
Fig. 4
Fig. 4
Reaction schemes for ATP (A), parvalbumin (B), troponin (C), the SR Ca2+ pump (D), and furaptra (= Dye; E). Table 3 gives the total reactant concentrations and Table 4 the reaction rate constants. At the resting values of free [Ca2+], free [Mg2+], and pH in Table 3, the fractional occupancies of the different states of the various buffers at rest are: A) ATP (1.000), CaATP (0.000); B) Parv (0.062), CaParv (0.258), MgParv (0.680); C) Trop (0.993), CaTrop (0.006), Ca2 Trop (.001); D) E (0.006), CaE (0.006), Ca2E (0.004), MgE (0.123), Mg2E (0.123), HE (0.062), H2E (0.615), H3E (0.062), H4E (0.001); E) Dye (0.451), CaDye (0.000), PrDye (0.548), CaPrDye (0.000). The percentage of furaptra in the protein-bound form at rest, 54.8%, is consistent with that estimated from furaptra’s apparent myoplasmic diffusion coefficient, 54% (Table 2).
Fig. 5
Fig. 5
Simulations of spatially-averaged ΔfCaD and Δ[Ca2+] with the compartment model of Figs. 3–4 at three different values of indicator KD,Ca: 1, 50 and 1,000 μM. A) The labeled traces show ΔfCaD for KD,Ca = 1 and 50 M; the unlabeled trace shows ΔfCaD for KD,Ca = 1,000 μM. KD,Ca here refers to the reaction of Ca2+ with protein-free indicator (cf. Fig. 4E); KD,Ca for protein-bound indicator is, in all cases, 2.14 times larger (cf. part E of Table 4). B) The continuous traces show the traces in A) after normalization to the same peak amplitude; the dashed trace is normalized Δ[Ca2+], which is identical in the three simulations since [DT] was set to 1 μM (see text). The values of the peak and FDHM of Δ[Ca2+] are 17.7 μM and 5.1 ms, respectively; the corresponding values for ΔfCaD are 0.702 and 61.6 ms, 0.140 and 8.2 ms, and 0.0117 and 5.3 ms (KD,Ca ’s of 1, 50 and 1000 μM, respectively). The Ca2+ release flux in the simulations was selected so that the amplitude and FDHM of the simulated ΔfCaD signal with KD,Ca = 50 μM would roughly match that observed with furaptra in a frog twitch fibre stimulated by an action potential. The equation for this flux (in μM/ms, referred to the volume of the half-sarcomere) is: Ca2+ flux(t) = 0 if t < 1.4 else = 17,642 · [1-exp(-(t-1.4)/τ1)]L · exp(-(t-1.4)/τ2) + 18.1 · [1-exp(-(t-1.4)/τ1)]L · exp(-(t-1.4)/τ3), where t is in ms, L is 5, and τ1, τ2, and τ3 are 1.5, 0.6 and 6 ms, respectively. With this flux, Δ[CaT] (the total amount of released Ca2+) is 365 μM, the peak rate of release is 151 μM/ms, the time of peak release is 3.1 ms, and the FDHM of release is 1.9 ms.
Fig. 6
Fig. 6
Simultaneous comparison of the ΔA signal from PDAA and the ΔF signal from furaptra in a frog twitch fibre stimulated to give an action potential at zero time (16 °C). The values of peak and FDHM of signals, after conversion to ΔfCaD units (Konishi et al., 1991), are 0.0096 and 6.3 ms (PDAA) and 0.119 and 9.1 ms (furaptra). The PDAA signal was obtained as a difference absorbance signal measured with wide-band filters centered at wavelengths 542 and 486 nm; the furaptra fluorescence signal was measured with a 420 ± 15 nm excitation filter and broad-band (490–590 nm) emission filter. Indicator concentrations were 1.25 mM (PDAA) and 0.26 mM (furaptra). Sarcomere length, 4.0 μm; fibre diameter, 90 μm.
Fig. 7
Fig. 7
Comparisons of normalized ΔF/FR signals measured simultaneously with mag-fluo-4 and furaptra in frog twitch fibres (16 °C). A) Responses to a single action potential. The values of peak and FDHM are 1.53 and 10.4 ms (mag-fluo-4) and −0.158 and 10.8 ms (furaptra). Sarcomere length, 3.6 μm; fibre diameter, 54 μm; indicator concentrations, 16 μM (mag-fluo-4) and 104 μM (furaptra). B) Responses to a single action potential and a 100-Hz train of five action potentials. The values of peak and FDHM elicited by the single action potential are 1.69 and 7.7 ms (mag-fluo-4) and −0.109 and 7.8 ms (furaptra). Sarcomere length, 3.5 μm; fibre diameter, 100 μm; indicator concentrations, 39 μM (mag-fluo-4) and 24 μM (furaptra). In part A, the standard deviation of the baseline noise is smaller for the furaptra trace than for the mag-fluo-4 trace; the reverse is true in part B. The fluorescence signals were measured as described by Hollingworth et al. (2009); 5 μM BTS was present in Ringer’s in both experiments.
Fig. 8
Fig. 8
Comparisons of normalized ΔF/FR signals measured simultaneously in frog fibres stimulated by an action potential (16 °C). A) Calcium-green-5N and furaptra. Peak and FDHM values are 0.96 and 36.8 ms (calcium-green-5N) and −0.132 and 10.2 ms (furaptra). Sarcomere length, 3.8 μm; fibre diameter, 101 μm. B) OGB-5N and furaptra. Peak and FDHM values are 1.38 and 13.3 ms (OGB-5N) and −0.101 and 9.7 ms (furaptra). Sarcomere length, 3.3 μm; fibre diameter, 93 μm. Signals were measured as described by Zhao et al. (1996) (part A) and Hollingworth et al. (2009) (part B); in B, the Ringer’s contained 5 μM BTS.
Fig. 9
Fig. 9
ΔfCaD and tension responses averaged from four mouse fast-twitch fibres injected with furaptra and stimulated by a single action potential (A) and a 5-shock 67-Hz train of action potentials (B). ΔfCaD waveforms were measured at long sarcomere lengths at 16 °C as described by Hollingworth et al. (1996). The scale for the tension traces is relative to the maximum value in the 5-shock train. Because BTS was not used in these experiments, the ΔfCaD waveforms may be slightly contaminated with a movement artifact.
Fig. 10
Fig. 10
Comparison of measured and simulated spatially-averaged waveforms in mouse fast-twitch fibres. The upper traces show furaptra ΔfCaD measurements (noisy traces, from parts A and B of Fig. 9) and simulations (noise-free traces, calculated with the multi-compartment model as described in the text). The lower traces show the SR Ca2+ release waveforms used in the simulations.
Fig. 11
Fig. 11
Comparison of spatially-averaged Δ[Ca2+] traces from the measurements and simulations of Figs. 9–10. The noisy traces were calculated from the measured ΔfCaD traces using equation 2 with KD,Ca = 96 μM; the noise-free traces are from the simulations and are thought to more accurately reflect the true spatially-averaged Δ[Ca2+]. In A, the values of peak and FDHM of the Δ[Ca2+] trace calculated with equation 2 are 17.5 μM and 4.6 ms, respectively; the corresponding values for the simulated Δ[Ca2+] trace are 16.1 μM and 3.7 ms.
Fig. 12
Fig. 12
Extremes of modeled concentration changes in the single action potential simulation of Fig. 10. In each panel, the continuous traces show the largest and smallest concentration change among all compartments in the model for the indicated variables: Δ[Ca2+]; Δ[CaParv]; Δ[CaPump]; and Δ[CaTrop]. The dashed traces show the spatially-averaged change for each variable. The increase in Δ[CaParv] occurs in two relatively distinct phases. The faster phase is due to Ca2+ binding to the Parv sites that are metal-free at rest (0.062 of the total; see legend of Fig. 4); the slower phase occurs as the Parv sites that have Mg2+ bound at rest (0.680 of the total) exchange Mg2+ for Ca2+.

Similar articles

Cited by

References

    1. Baker AJ, Brandes R, Schreur JH, Camacho SA, Weiner MW. Protein and acidosis alter calcium-binding and fluorescence spectra of the calcium indicator indo-1. Biophys J. 1994;67:1646–1654. - PMC - PubMed
    1. Baylor SM, Chandler WK, Marshall MW. Dichroic components of Arsenazo III and Dichlorophosphonazo III signals in skeletal muscle fibres. J Physiol. 1982a;331:179–210. - PMC - PubMed
    1. Baylor SM, Chandler WK, Marshall MW. Use of metallochromic dyes to measure changes in myoplasmic calcium during activity in frog skeletal muscle fibres. J Physiol. 1982b;331:139–177. - PMC - PubMed
    1. Baylor SM, Chandler WK, Marshall MW. Sarcoplasmic reticulum calcium release in frog skeletal muscle fibres estimated from arsenazo III calcium transients. J Physiol. 1983;344:625–666. - PMC - PubMed
    1. Baylor SM, Quinta-Ferreira ME, Hui CS. Isotropic components of antipyrylazo III signals from frog skeletal muscle fibers. In: Rubin RP, Weiss G, Putney JW Jr, editors. Calcium and Biological Systems. Plenum Publishing Corp; New York: 1985. pp. 339–349.

Publication types

MeSH terms