

Lipopolysaccharide differentially decreases plasma acyl and desacyl ghrelin levels in rats: potential role of the circulating ghrelin-acylating enzyme GOAT
- PMID: 20599577
- PMCID: PMC4067316
- DOI: 10.1016/j.peptides.2010.06.015
Lipopolysaccharide differentially decreases plasma acyl and desacyl ghrelin levels in rats: potential role of the circulating ghrelin-acylating enzyme GOAT
Abstract
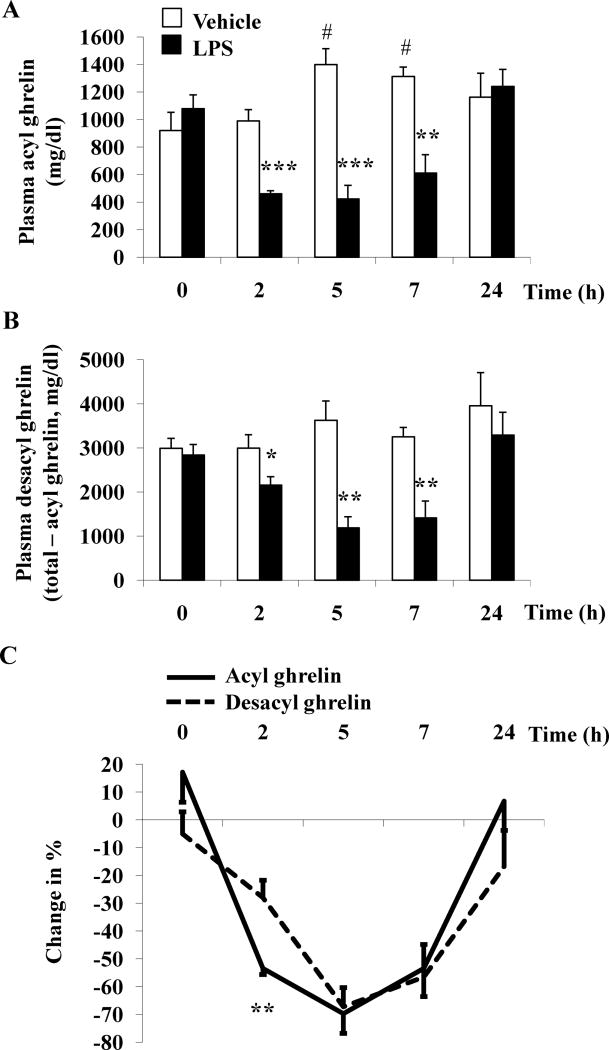
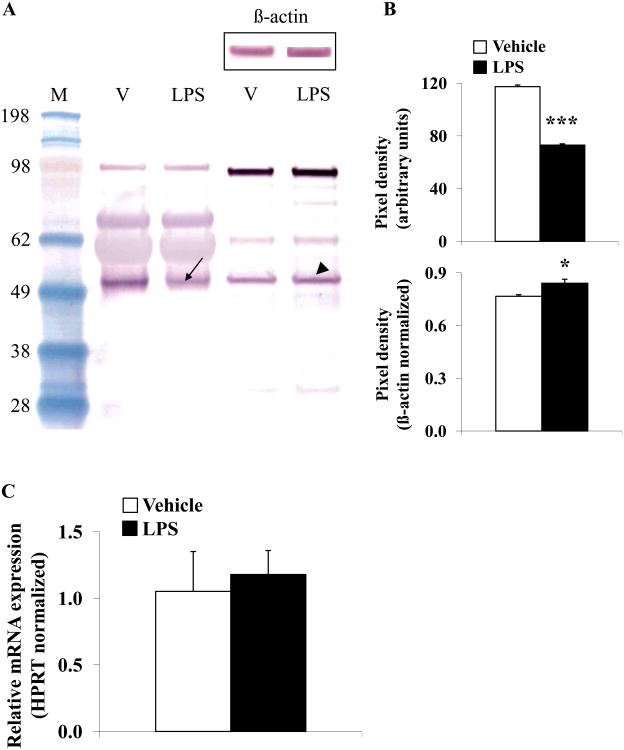
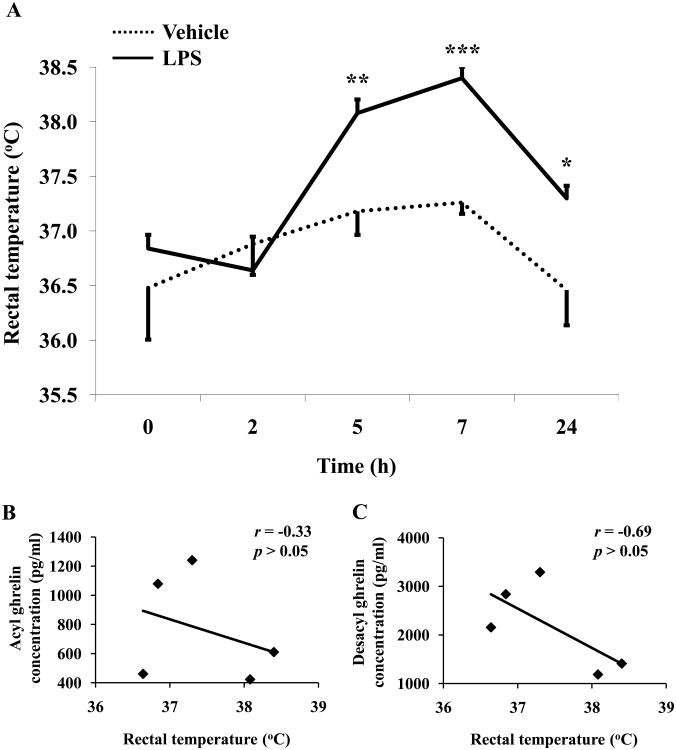
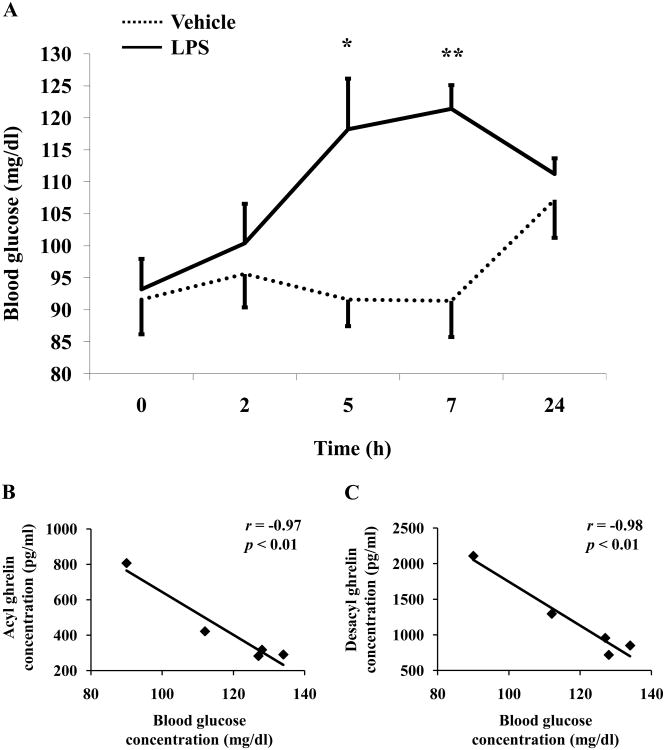
Bacterial lipopolysaccharide (LPS) in rodents is an established model for studying innate immune responses to gram-negative bacteria and mimicking symptoms of infections including reduced food intake associated with decreased circulating total ghrelin levels. The ghrelin-acylating enzyme, ghrelin-O-acyltransferase (GOAT) involved in the formation of acyl ghrelin (AG) was recently identified. We investigated changes in circulating AG, desacyl ghrelin (DG) and GOAT induced by intraperitoneal LPS (100 microg/kg) and associated changes in food intake. Plasma AG and total ghrelin were assessed by radioimmunoassay, GOAT protein by Western blot and mRNA by RT-qPCR. DG was derived from total minus AG. Plasma AG and DG were decreased at 2, 5 and 7 h (p<0.01) post-injection compared to vehicle and recovered at 24 h. At 2 h there was a significantly greater decrease of AG (-53%) than DG (-28%) resulting in a decreased AG/DG ratio (1:5, p<0.01), which thereafter returned to pre-injection values (1:3). This altered ratio was associated with a 38% decrease in plasma GOAT protein compared to vehicle (p<0.001), whereas gastric GOAT protein was slightly increased by 10% (p<0.05). GOAT mRNA expression was unchanged. Food intake was reduced by 58% measured during the 1.5-2 h period post-LPS injection. Decreased plasma AG and DG preceded the rise in rectal temperature and blood glucose that peaked at 7 h. These data indicate that LPS induces a long-lasting reduction of AG and DG levels that may have a bearing with the decrease in food intake. The faster drop in AG than DG within 2 h is associated with reduced circulating GOAT.
Published by Elsevier Inc.
Figures
Similar articles
-
Lipopolysaccharide increases gastric and circulating NUCB2/nesfatin-1 concentrations in rats.Peptides. 2011 Sep;32(9):1942-7. doi: 10.1016/j.peptides.2011.07.006. Epub 2011 Jul 18. Peptides. 2011. PMID: 21782869 Free PMC article.
-
Plasma ghrelin isoforms and gastric ghrelin O-acyltransferase expression are influenced by Helicobacter pylori status.Nutrition. 2012 Oct;28(10):967-72. doi: 10.1016/j.nut.2011.11.023. Epub 2012 Apr 6. Nutrition. 2012. PMID: 22483414 Clinical Trial.
-
Abdominal surgery inhibits circulating acyl ghrelin and ghrelin-O-acyltransferase levels in rats: role of the somatostatin receptor subtype 2.Am J Physiol Gastrointest Liver Physiol. 2011 Aug;301(2):G239-48. doi: 10.1152/ajpgi.00018.2011. Epub 2011 Jun 2. Am J Physiol Gastrointest Liver Physiol. 2011. PMID: 21636529 Free PMC article.
-
Stress-related alterations of acyl and desacyl ghrelin circulating levels: mechanisms and functional implications.Peptides. 2011 Nov;32(11):2208-17. doi: 10.1016/j.peptides.2011.07.002. Epub 2011 Jul 12. Peptides. 2011. PMID: 21782868 Free PMC article. Review.
-
Endocrine impact of Helicobacter pylori: focus on ghrelin and ghrelin o-acyltransferase.World J Gastroenterol. 2011 Mar 14;17(10):1249-60. doi: 10.3748/wjg.v17.i10.1249. World J Gastroenterol. 2011. PMID: 21455323 Free PMC article. Review.
Cited by
-
Lipopolysaccharide increases gastric and circulating NUCB2/nesfatin-1 concentrations in rats.Peptides. 2011 Sep;32(9):1942-7. doi: 10.1016/j.peptides.2011.07.006. Epub 2011 Jul 18. Peptides. 2011. PMID: 21782869 Free PMC article.
-
Acylation of ghrelin is increased in heart failure and decreases post heart transplantation.Scand Cardiovasc J. 2014 Dec;48(6):343-8. doi: 10.3109/14017431.2014.955052. Epub 2014 Sep 18. Scand Cardiovasc J. 2014. PMID: 25130063 Free PMC article.
-
Association of obestatin, ghrelin, and inflammatory cytokines in obese patients with non-alcoholic fatty liver disease.Obes Surg. 2011 Nov;21(11):1750-7. doi: 10.1007/s11695-011-0475-1. Obes Surg. 2011. PMID: 21744131
-
Administration of exogenous acylated ghrelin or rikkunshito, an endogenous ghrelin enhancer, improves the decrease in postprandial gastric motility in an acute restraint stress mouse model.Neurogastroenterol Motil. 2014 Jun;26(6):821-31. doi: 10.1111/nmo.12336. Epub 2014 Mar 30. Neurogastroenterol Motil. 2014. PMID: 24684160 Free PMC article.
-
Ghrelin o-acyl transferase: bridging ghrelin and energy homeostasis.Int J Pept. 2011;2011:217957. doi: 10.1155/2011/217957. Epub 2011 Sep 15. Int J Pept. 2011. PMID: 21941572 Free PMC article.
References
-
- Ariyasu H, Takaya K, Hosoda H, Iwakura H, Ebihara K, Mori K, et al. Delayed short-term secretory regulation of ghrelin in obese animals: evidenced by a specific RIA for the active form of ghrelin. Endocrinology. 2002;143:3341–50. - PubMed
-
- Basa NR, Wang L, Arteaga JR, Heber D, Livingston EH, Taché Y. Bacterial lipopolysaccharide shifts fasted plasma ghrelin to postprandial levels in rats. Neurosci Lett. 2003;343:25–8. - PubMed
-
- Bednarek MA, Feighner SD, Pong SS, McKee KK, Hreniuk DL, Silva MV, et al. Structure-function studies on the new growth hormone-releasing peptide, ghrelin: minimal sequence of ghrelin necessary for activation of growth hormone secretagogue receptor 1a. J Med Chem. 2000;43:4370–6. - PubMed
-
- Bodosi B, Gardi J, Hajdu I, Szentirmai E, Obal F, Jr, Krueger JM. Rhythms of ghrelin, leptin, and sleep in rats: effects of the normal diurnal cycle, restricted feeding, and sleep deprivation. Am J Physiol Regul Integr Comp Physiol. 2004;287:R1071–9. - PubMed
-
- Broglio F, Gottero C, Prodam F, Destefanis S, Gauna C, Me E, et al. Ghrelin secretion is inhibited by glucose load and insulin-induced hypoglycaemia but unaffected by glucagon and arginine in humans. Clin Endocrinol (Oxf) 2004;61:503–9. - PubMed
Publication types
MeSH terms
Substances
Grants and funding
LinkOut - more resources
Full Text Sources
