Clinical Trial
. 2010 Dec 1;504(1):50-5.
doi: 10.1016/j.abb.2010.06.019. Epub 2010 Jun 22.

Dose-dependent response of serum lutein and macular pigment optical density to supplementation with lutein esters

Affiliations
Clinical Trial

Dose-dependent response of serum lutein and macular pigment optical density to supplementation with lutein esters

Richard A Bone et al. Arch Biochem Biophys. .

Abstract

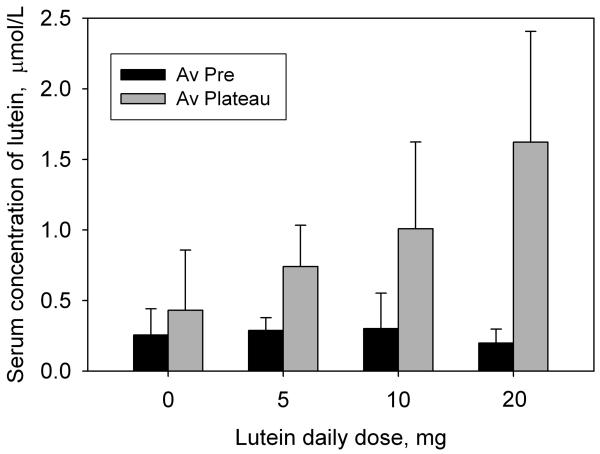
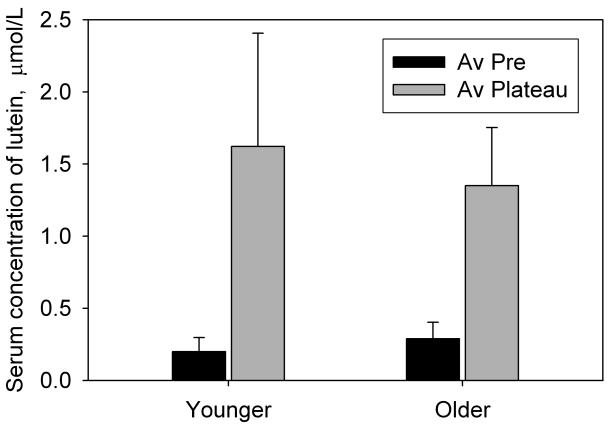
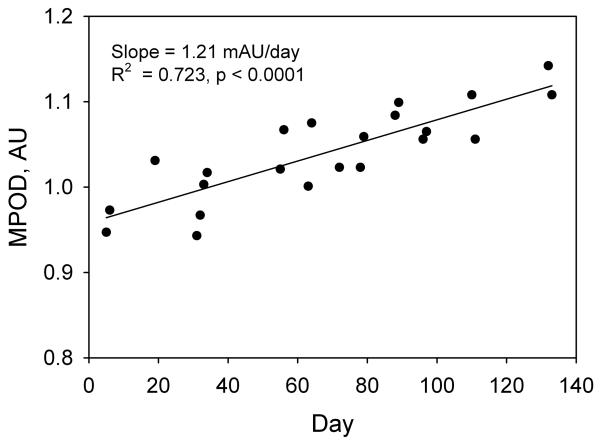
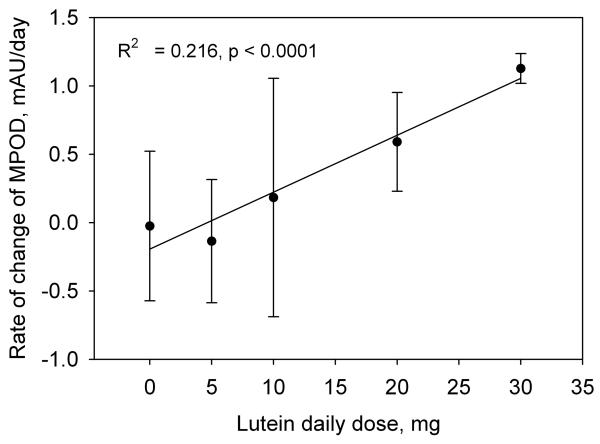
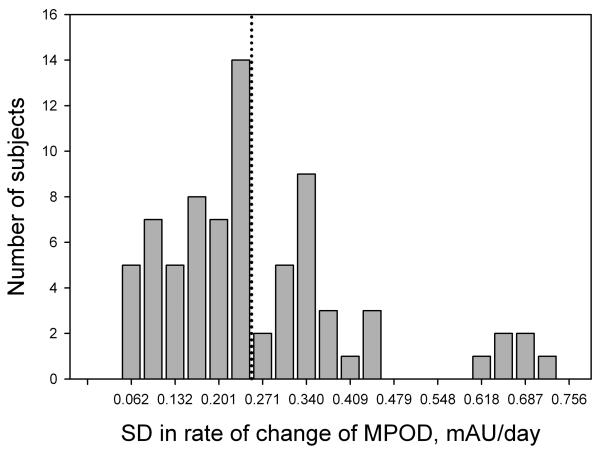
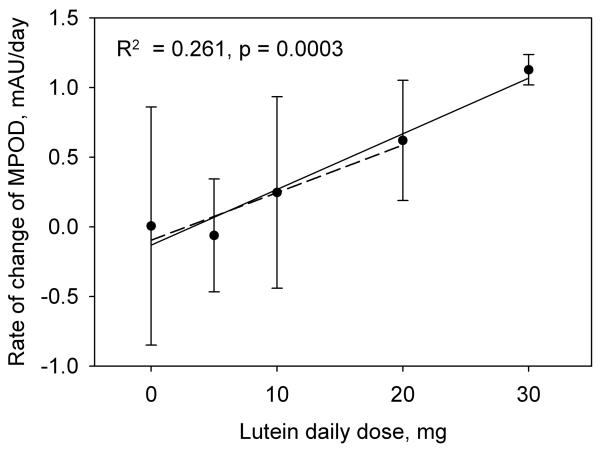
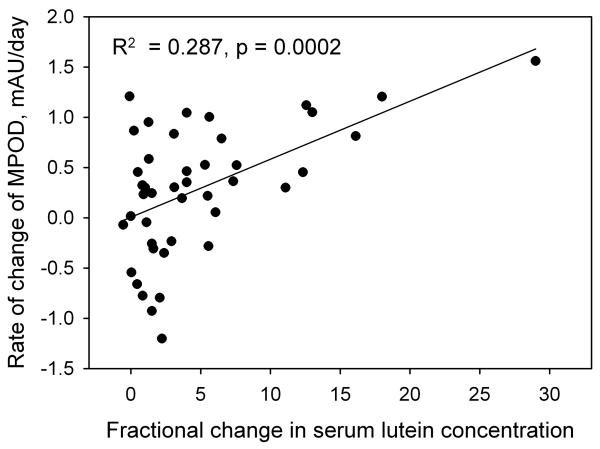
We conducted a study to determine the effect of different doses of a lutein supplement on serum lutein concentration and macular pigment optical density (MPOD). Lutein is one of the major components of human macular pigment. Eighty-seven subjects received daily doses of 5, 10, or 20 mg of lutein, or a placebo, over a 140 day period. Serum lutein concentration was determined by HPLC and MPOD by heterochromatic flicker photometry (HFP). Serum lutein responded positively, except in the placebo group, reaching a plateau that, averaged for each dosage group, was linearly dependent on dose. Likewise MPOD, on average, increased at a rate that varied linearly with dose. For subjects deemed more proficient at HFP, approximately 29% of the variability in MPOD response could be attributed to a linear dependence on the fractional change in serum lutein concentration. We did not detect any significant influence of age on serum lutein uptake or MPOD response.


Figures

Fig. 1
Fig. 1
The effect of different lutein doses on the concentration of lutein in the serum. The black bars represent the concentrations of serum lutein prior to supplementation, averaged for all subjects. The gray bars represent the average concentrations of serum lutein after these had reached a steady-state plateau, again averaged for all subjects. Standard deviations are represented by the error bars.
Fig. 2
Fig. 2
The effect of age on serum lutein concentration. The black bars represent the concentrations of serum lutein prior to supplementation, averaged for 24 younger subjects, ages 18 to 29 years (group 4) and 14 older subjects, ages 51 to 64 (group 5). The gray bars represent the average concentrations of serum lutein after these had reached a steady-state plateau, again averaged for each of the two groups. Standard deviations are represented by the error bars.
Fig. 3
Fig. 3
MPOD measurements obtained throughout the lutein supplementation period from a single subject in the 10 mg/day group.
Fig. 4
Fig. 4
The rate of change of MPOD, i.e. the slope of graphs such as Fig.3, averaged for the subjects in each of the dosage groups 1 through 4. Also included are data obtained from our earlier study involving a 30 mg/day lutein dose [8]. Standard deviations are represented by the error bars.
Fig. 5
Fig. 5
Histogram of the standard deviations in the rates of change of MPOD for all subjects in dosage groups 1 through 4. Forty six subjects whose standard deviations were less than 0.250 (those in bins to the left of the dotted line) were selected for additional analysis.
Fig. 6
Fig. 6
The rate of change of MPOD averaged for the subjects in each of the dosage groups 1 through 4 whose standard deviations in the rates of change of MPOD were less than 0.250. The error bars represent standard deviations for the different dosage groups. The solid regression line and associated data (R2 = 0.261, p < 0.0003) were obtained after including data from our earlier study involving a 30 mg/day lutein dose [8]. For comparison, the dashed regression line excludes the 30 mg/day data.
Fig. 7
Fig. 7
The rate of change of MPOD as a function of the fractional change in serum lutein concentration (plateau value minus pre-supplementation value, divided by the pre-supplementation value). These data are for the 46 subjects in groups 1 through 4 whose standard deviations in the rates of change of MPOD were less than 0.250.

Similar articles

Cited by

References

    1. Eye Disease Case-Control Study Group Arch. Ophthalmol. 1993;111:104–109. - PubMed
    1. SanGiovanni J, Chew E, Clemons T, Ferris F, Gensler G, Lindblad A, Milton R, Seddon J, Sperduto R. Arch. Ophthalmol. 2007;125:1225–1232. - PubMed
    1. Seddon JM, Ajani UA, Sperduto RD, Hiller R, Blair N, Burton TC, Farber MD, Gragoudas ES, Haller J, Miller DT, Yannuzzi LA, Willett WC. JAMA. 1994;272:1413–1420. - PubMed
    1. Beatty S, Koh HH, Phil M, Henson DB, Boulton M. Surv. Ophthalmol. 2000;45:115–134. - PubMed
    1. Sparrow J, Kim S. In: Carotenoids: physical, chemical, and biological functions and properties. Landrum J, editor. Taylor and Francis Group; Boca Raton: 2010. pp. 355–363.

Publication types