

Crystal structures of inhibitor complexes of human T-cell leukemia virus (HTLV-1) protease
- PMID: 20600105
- PMCID: PMC2918672
- DOI: 10.1016/j.jmb.2010.06.052
Crystal structures of inhibitor complexes of human T-cell leukemia virus (HTLV-1) protease
Abstract
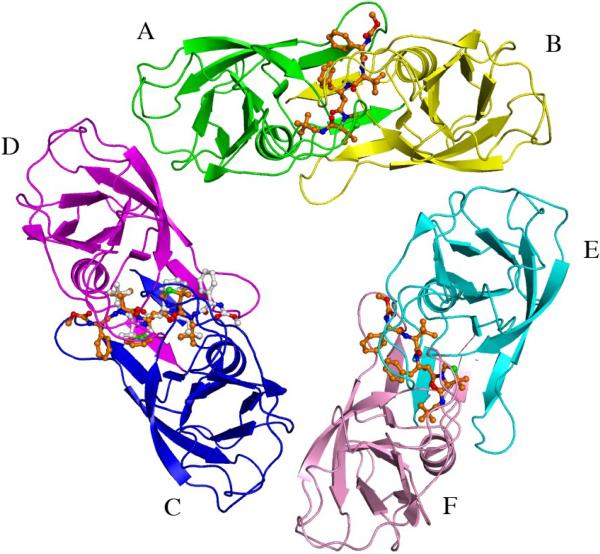
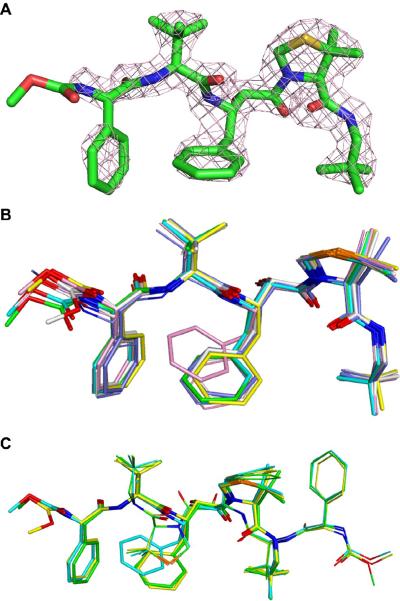
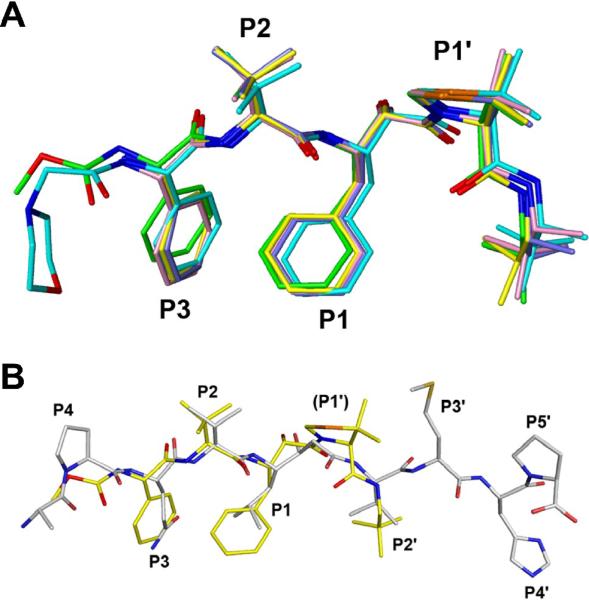
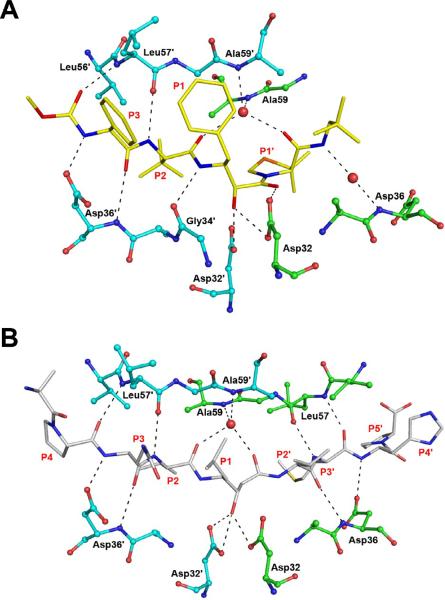
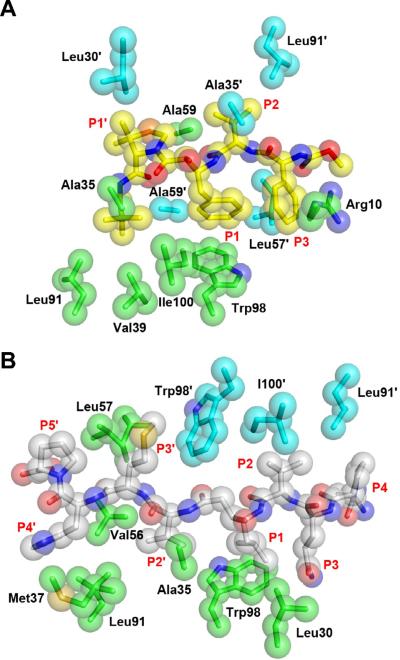
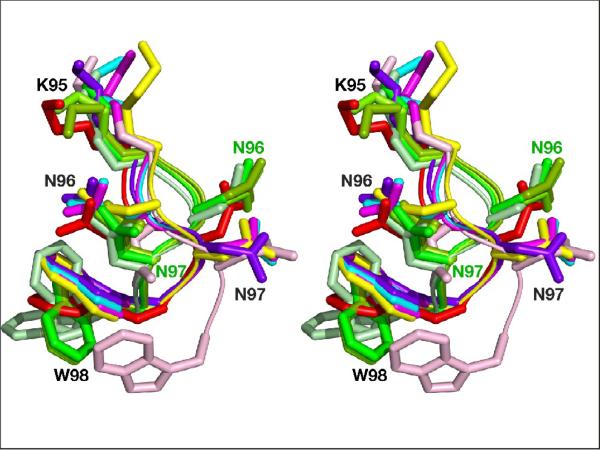
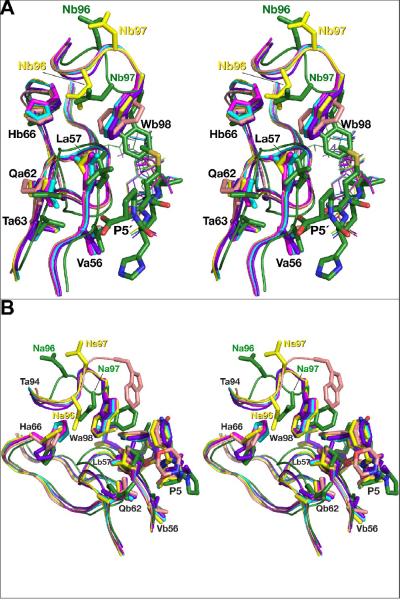
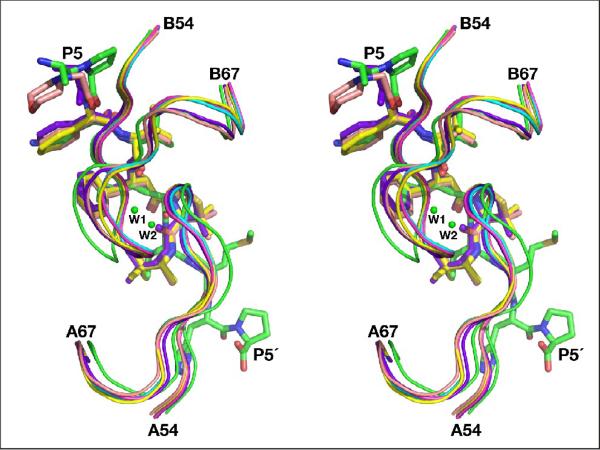
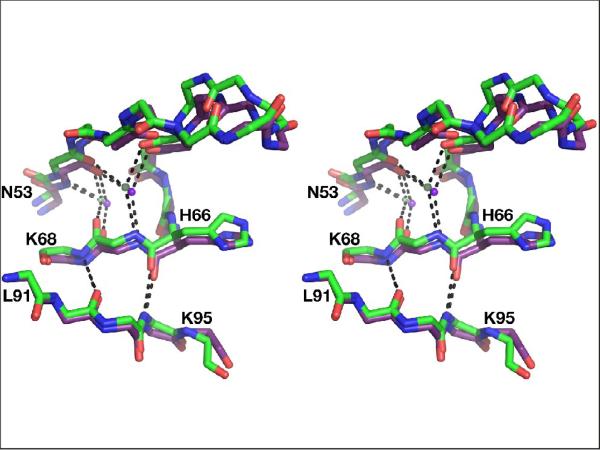
Human T-cell leukemia virus type 1 (HTLV-1) is a retrovirus associated with several serious diseases, such as adult T-cell leukemia and tropical spastic paraparesis/myelopathy. For a number of years, the protease (PR) encoded by HTLV-1 has been a target for designing antiviral drugs, but that effort was hampered by limited available structural information. We report a high-resolution crystal structure of HTLV-1 PR complexed with a statine-containing inhibitor, a significant improvement over the previously available moderate-resolution structure. We also report crystal structures of the complexes of HTLV-1 PR with five different inhibitors that are more compact and more potent. A detailed study of structure-activity relationships was performed to interpret in detail the influence of the polar and hydrophobic interactions between the inhibitors and the protease.
Published by Elsevier Ltd.
Figures
Similar articles
-
Privileged Structures Meet Human T-Cell Leukemia Virus-1 (HTLV-1): C2-Symmetric 3,4-Disubstituted Pyrrolidines as Nonpeptidic HTLV-1 Protease Inhibitors.J Med Chem. 2015 Jun 11;58(11):4845-50. doi: 10.1021/acs.jmedchem.5b00346. Epub 2015 May 22. J Med Chem. 2015. PMID: 26000468
-
Design and synthesis of several small-size HTLV-I protease inhibitors with different hydrophilicity profiles.Bioorg Med Chem Lett. 2011 Apr 15;21(8):2425-9. doi: 10.1016/j.bmcl.2011.02.066. Epub 2011 Feb 18. Bioorg Med Chem Lett. 2011. PMID: 21392990
-
Crystal structure of human T cell leukemia virus protease, a novel target for anticancer drug design.Proc Natl Acad Sci U S A. 2005 Dec 20;102(51):18332-7. doi: 10.1073/pnas.0509335102. Epub 2005 Dec 13. Proc Natl Acad Sci U S A. 2005. PMID: 16352712 Free PMC article.
-
The protease of human T-cell leukemia virus type-1 is a potential therapeutic target.Curr Pharm Des. 2007;13(12):1285-94. doi: 10.2174/138161207780618849. Curr Pharm Des. 2007. PMID: 17504236 Review.
-
Design of inhibitors against HIV, HTLV-I, and Plasmodium falciparum aspartic proteases.Biol Chem. 2004 Nov;385(11):1035-9. doi: 10.1515/BC.2004.134. Biol Chem. 2004. PMID: 15576323 Review.
Cited by
-
Dimer Interface Organization is a Main Determinant of Intermonomeric Interactions and Correlates with Evolutionary Relationships of Retroviral and Retroviral-Like Ddi1 and Ddi2 Proteases.Int J Mol Sci. 2020 Feb 17;21(4):1352. doi: 10.3390/ijms21041352. Int J Mol Sci. 2020. PMID: 32079302 Free PMC article.
-
Combining Molecular Dynamic Information and an Aspherical-Atom Data Bank in the Evaluation of the Electrostatic Interaction Energy in Multimeric Protein-Ligand Complex: A Case Study for HIV-1 Protease.Molecules. 2021 Jun 24;26(13):3872. doi: 10.3390/molecules26133872. Molecules. 2021. PMID: 34202892 Free PMC article.
-
New directions for protease inhibitors directed drug discovery.Biopolymers. 2016 Nov 4;106(4):563-79. doi: 10.1002/bip.22780. Biopolymers. 2016. PMID: 26584340 Free PMC article. Review.
-
Design of new potent HTLV-1 protease inhibitors: in silico study.Mol Biol Res Commun. 2016 Mar;5(1):19-30. Mol Biol Res Commun. 2016. PMID: 27844017 Free PMC article.
-
Viral proteases: Structure, mechanism and inhibition.Enzymes. 2021;50:301-333. doi: 10.1016/bs.enz.2021.09.004. Epub 2021 Nov 17. Enzymes. 2021. PMID: 34861941 Free PMC article.
References
-
- Franchini G, Fukumoto R, Fullen JR. T-cell control by human T-cell leukemia/lymphoma virus type 1. Int. J. Hematol. 2003;78:280–296. - PubMed
-
- Uchiyama T. Human T cell leukemia virus type I (HTLV-I) and human diseases. Annu. Rev. Immunol. 1997;15:15–37. - PubMed
-
- Ishikawa T. Current status of therapeutic approaches to adult T-cell leukemia. Intl. J. Hematology. 2003;78:304–311. - PubMed
-
- Nasr R, El Sabban ME, Karam JA, Dbaibo G, Kfoury Y, Arnulf B, Lepelletier Y, Bex F, de The H, Hermine O, Bazarbachi A. Efficacy and mechanism of action of the proteasome inhibitor PS-341 in T-cell lymphomas and HTLV-I associated adult T-cell leukemia/lymphoma. Oncogene. 2005;24:419–430. - PubMed
-
- Kannagi M, Harashima N, Kurihara K, Utsunomiya A, Tanosaki R, Masuda M. Adult T-cell leukemia: future prophylaxis and immunotherapy. Expert. Rev. Anticancer Ther. 2004;4:369–376. - PubMed
Publication types
MeSH terms
Substances
Associated data
- Actions
- Actions
- Actions
- Actions
- Actions
- Actions
Grants and funding
LinkOut - more resources
Full Text Sources
Research Materials
