

A dynamic model of saliva secretion
- PMID: 20600135
- PMCID: PMC2954280
- DOI: 10.1016/j.jtbi.2010.06.027
A dynamic model of saliva secretion
Erratum in
- J Theor Biol. 2013 Jan 21;317:428
Abstract
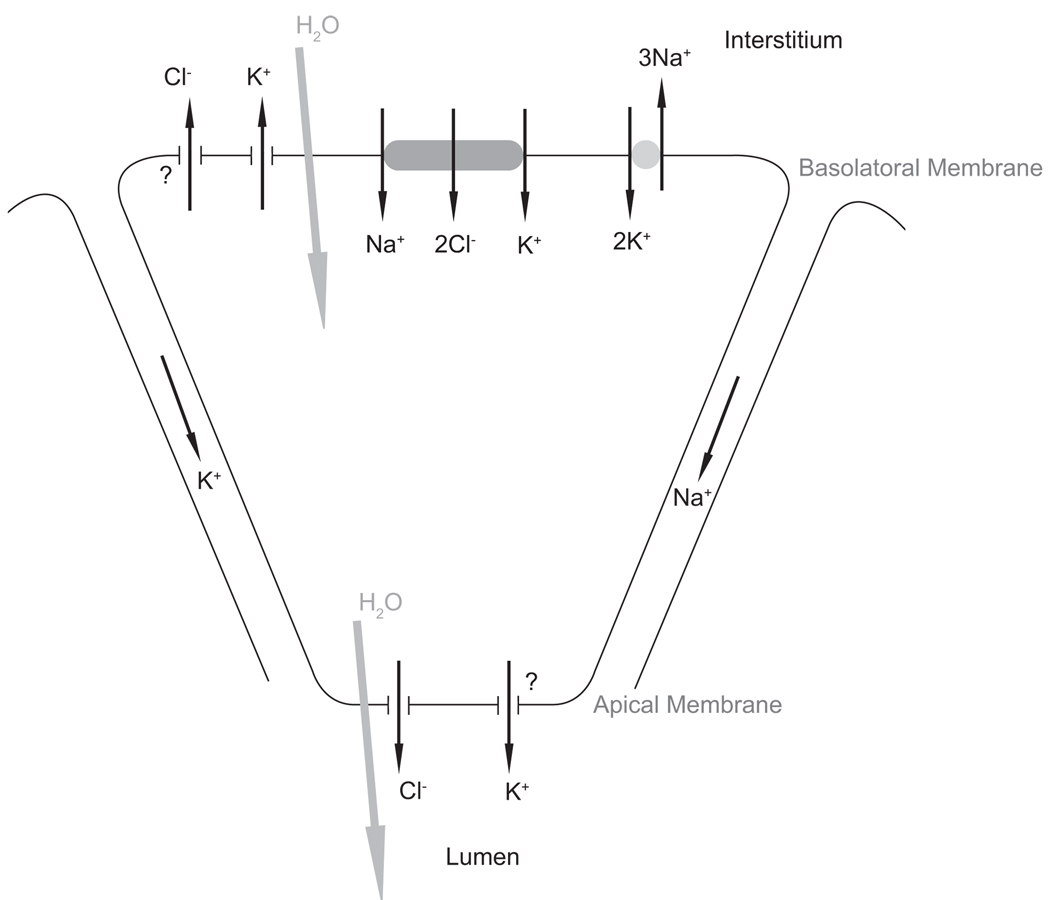
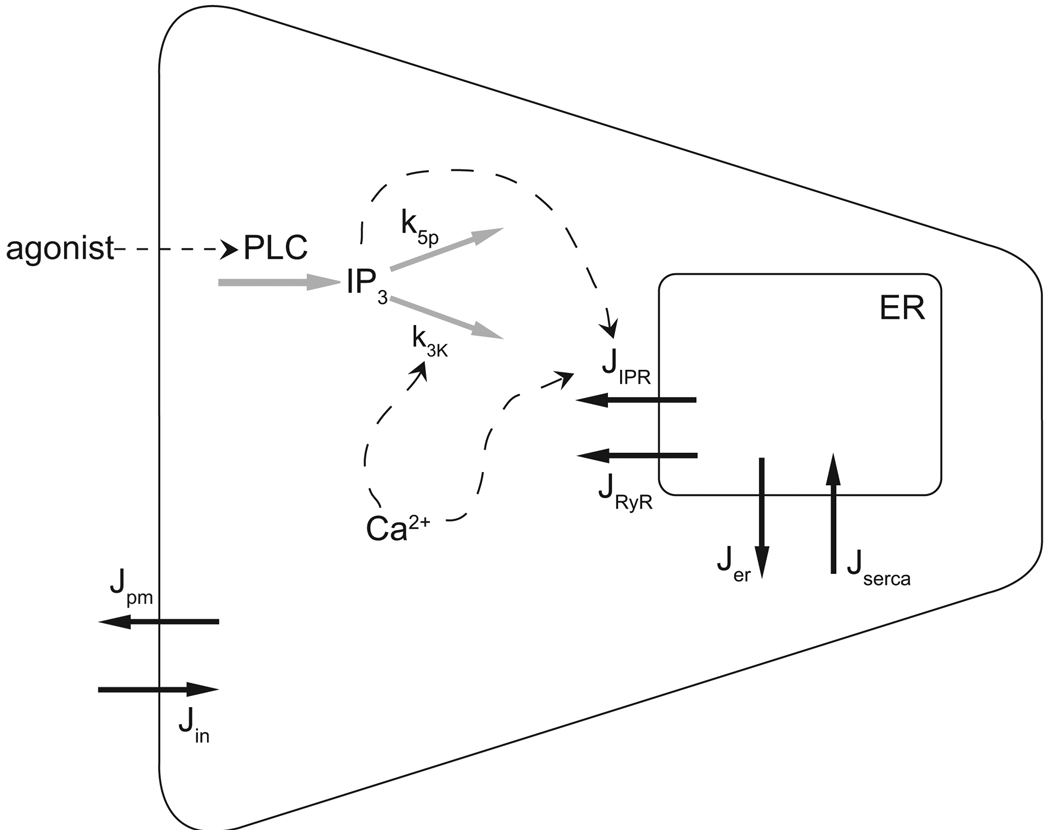
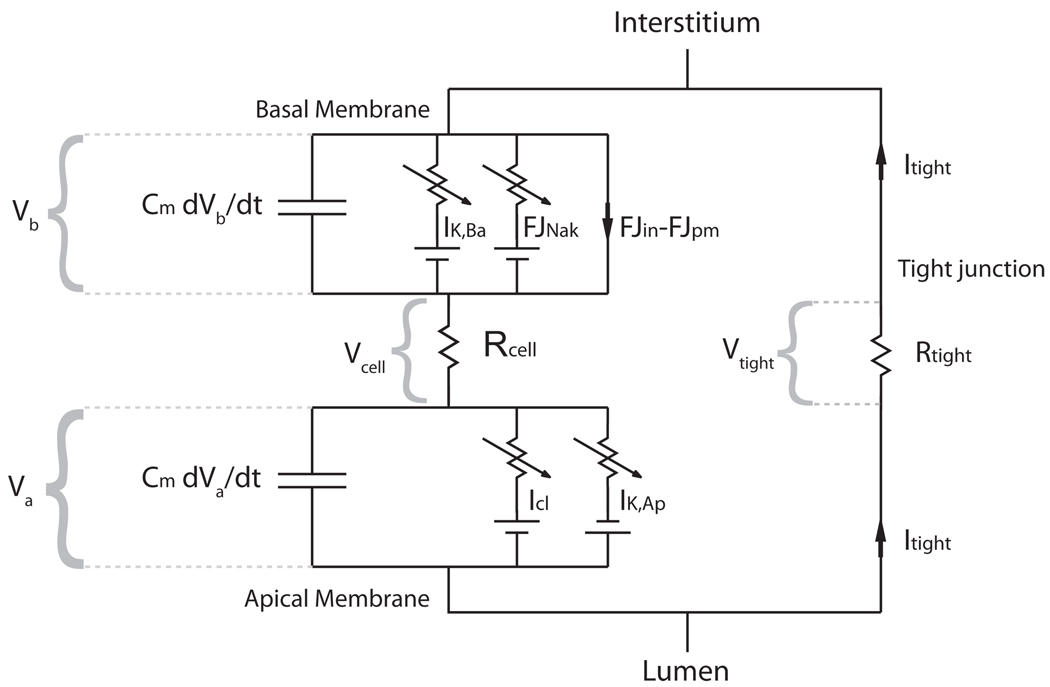
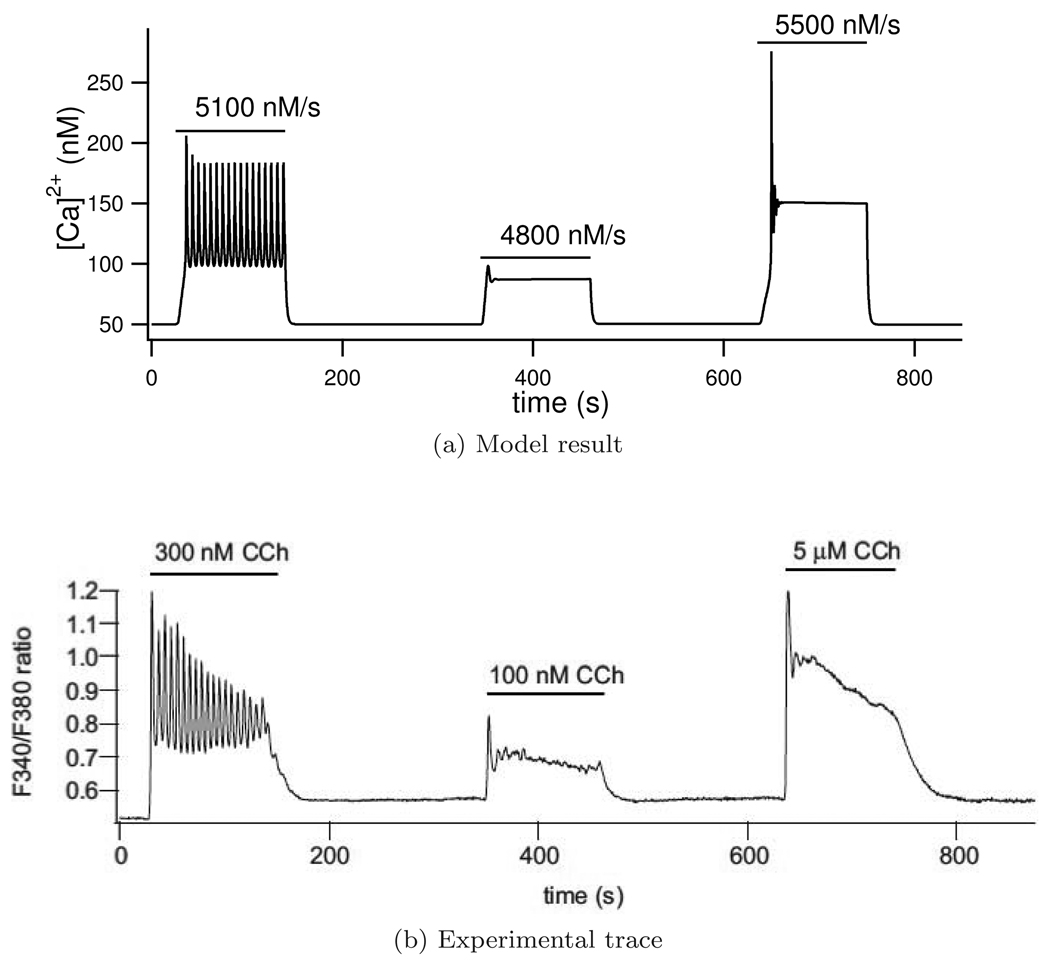
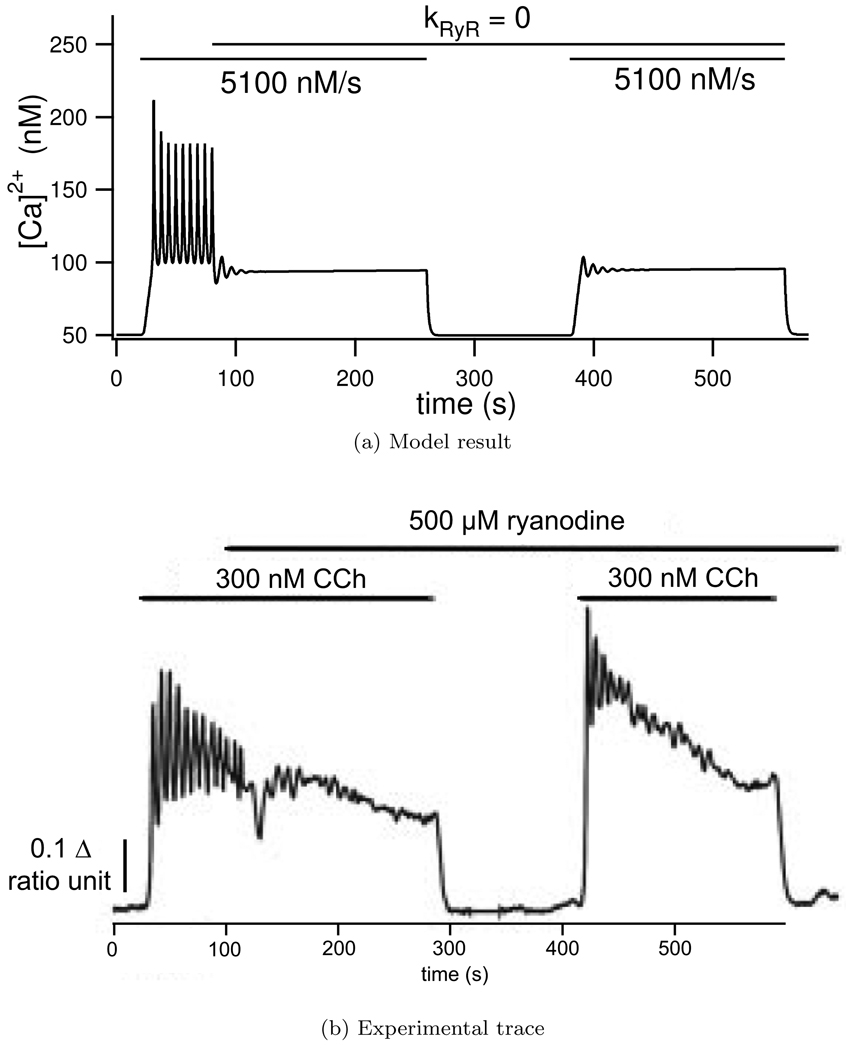
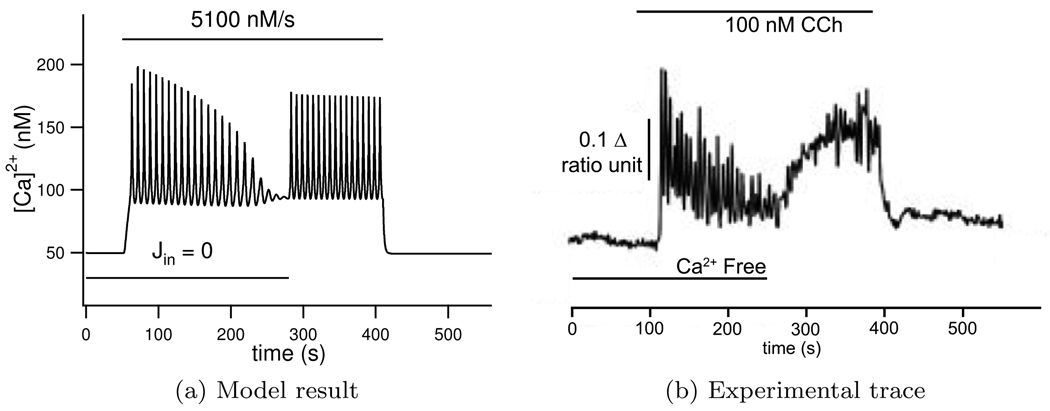
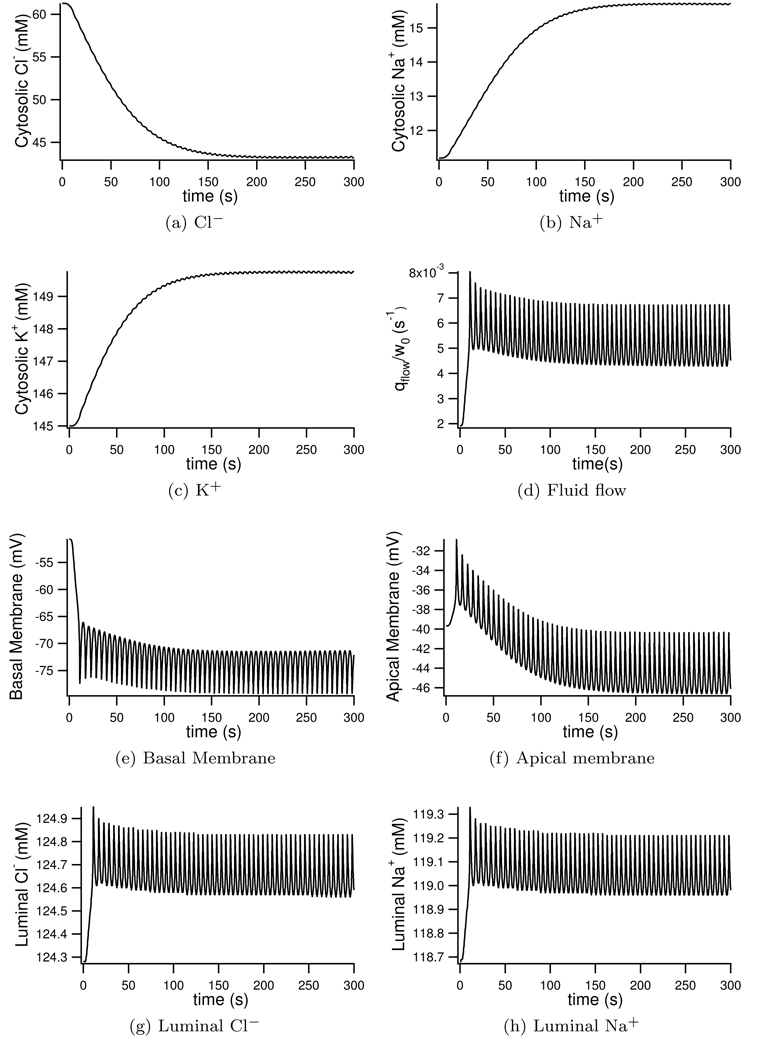
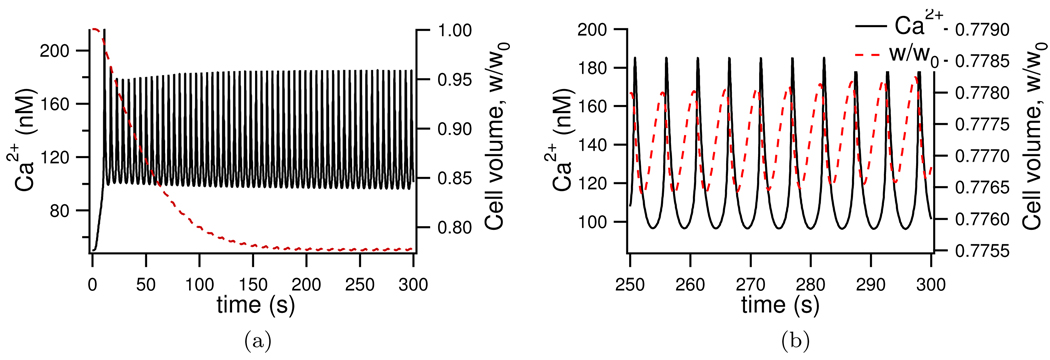
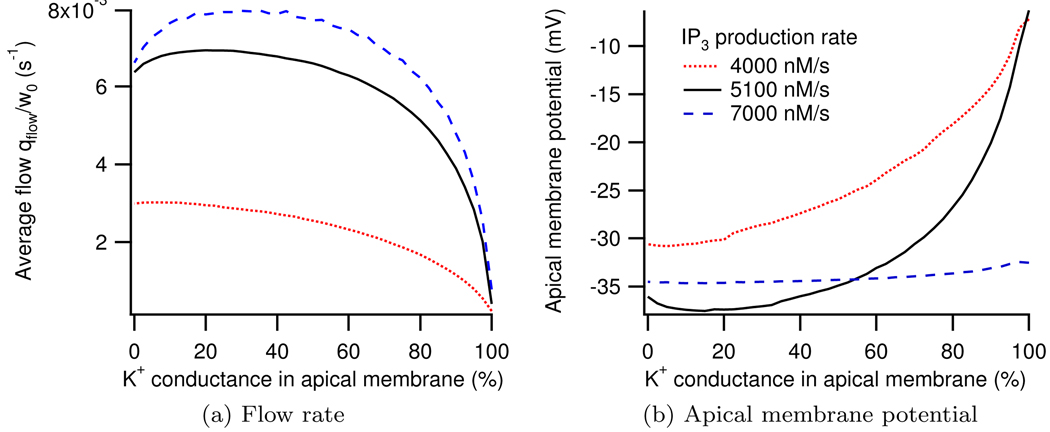
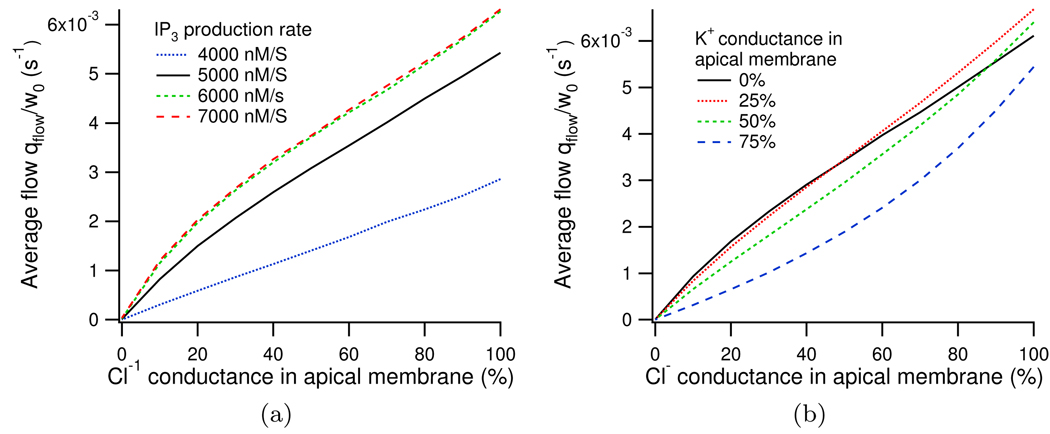
We construct a mathematical model of the parotid acinar cell with the aim of investigating how the distribution of K(+) and Cl(-) channels affects saliva production. Secretion of fluid is initiated by Ca(2+) signals acting on Ca(2+) dependent K(+) and Cl(-) channels. The opening of these channels facilitates the movement of Cl(-) ions into the lumen which water follows by osmosis. We use recent results into both the release of Ca(2+) from internal stores via the inositol (1,4,5)-trisphosphate receptor (IP(3)R) and IP(3) dynamics to create a physiologically realistic Ca(2+) model which is able to recreate important experimentally observed behaviours seen in parotid acinar cells. We formulate an equivalent electrical circuit diagram for the movement of ions responsible for water flow which enables us to calculate and include distinct apical and basal membrane potentials to the model. We show that maximum saliva production occurs when a small amount of K(+) conductance is located at the apical membrane, with the majority in the basal membrane. The maximum fluid output is found to coincide with a minimum in the apical membrane potential. The traditional model whereby all Cl(-) channels are located in the apical membrane is shown to be the most efficient Cl(-) channel distribution.
Copyright © 2010 Elsevier Ltd. All rights reserved.
Figures
Similar articles
-
New saliva secretion model based on the expression of Na+-K+ pump and K+ channels in the apical membrane of parotid acinar cells.Pflugers Arch. 2018 Apr;470(4):613-621. doi: 10.1007/s00424-018-2109-0. Epub 2018 Jan 17. Pflugers Arch. 2018. PMID: 29344775
-
A mathematical model of fluid secretion from a parotid acinar cell.J Theor Biol. 2007 Sep 7;248(1):64-80. doi: 10.1016/j.jtbi.2007.04.021. Epub 2007 May 3. J Theor Biol. 2007. PMID: 17559884 Free PMC article.
-
A Model of Dynamics in an Accurate Reconstruction of Parotid Acinar Cells.Bull Math Biol. 2019 May;81(5):1394-1426. doi: 10.1007/s11538-018-00563-z. Epub 2019 Jan 14. Bull Math Biol. 2019. PMID: 30644065 Free PMC article.
-
Regulation of electrolyte and fluid secretion in salivary acinar cells.Am J Physiol. 1992 Dec;263(6 Pt 1):G823-37. doi: 10.1152/ajpgi.1992.263.6.G823. Am J Physiol. 1992. PMID: 1476190 Review.
-
Chloride channels and salivary gland function.Crit Rev Oral Biol Med. 1999;10(2):199-209. doi: 10.1177/10454411990100020601. Crit Rev Oral Biol Med. 1999. PMID: 10759422 Review.
Cited by
-
Modeling calcium waves in an anatomically accurate three-dimensional parotid acinar cell.J Theor Biol. 2017 Apr 21;419:383-393. doi: 10.1016/j.jtbi.2016.04.030. Epub 2016 May 4. J Theor Biol. 2017. PMID: 27155044 Free PMC article.
-
New saliva secretion model based on the expression of Na+-K+ pump and K+ channels in the apical membrane of parotid acinar cells.Pflugers Arch. 2018 Apr;470(4):613-621. doi: 10.1007/s00424-018-2109-0. Epub 2018 Jan 17. Pflugers Arch. 2018. PMID: 29344775
-
A Mathematical Model Supports a Key Role for Ae4 (Slc4a9) in Salivary Gland Secretion.Bull Math Biol. 2018 Feb;80(2):255-282. doi: 10.1007/s11538-017-0370-6. Epub 2017 Dec 5. Bull Math Biol. 2018. PMID: 29209914 Free PMC article.
-
Modelling the effects of calcium waves and oscillations on saliva secretion.J Theor Biol. 2012 Jul 21;305:45-53. doi: 10.1016/j.jtbi.2012.04.009. Epub 2012 Apr 14. J Theor Biol. 2012. PMID: 22521411 Free PMC article.
-
Expression of BK channels and Na+-K+ pumps in the apical membrane of lacrimal acinar cells suggests a new molecular mechanism for primary tear-secretion.Ocul Surf. 2019 Apr;17(2):272-277. doi: 10.1016/j.jtos.2019.01.007. Epub 2019 Jan 24. Ocul Surf. 2019. PMID: 30685438 Free PMC article.
References
-
- Benjamin BA, Johnson EA. A quantitative description of the Na-K-2Cl cotransporter and its conformity to experimental data. AJP - Renal Physiology. 1997;273(3):F473–F482. - PubMed
-
- Berridge MJ, Prince WT. Transepithelial potential changes during stimulation of isolated salivary glands with 5-hydroxytryptamine and cyclic Amp. Journal of Experimental Biology. 1972;56(1):139–153. - PubMed
-
- Berry C. Water permeability and pathways in the proximal tubule. The American journal of physiology. 1983;245(3):F279. - PubMed
-
- Bruce JIE, Shuttleworth TJ, Giovannucci DR, Yule DI. Phosphorylation of inositol 1,4,5-trisphosphate receptors in parotid acinar cells. a mechanism for the synergistic effects of cAMP on Ca2+ signaling. J Biol Chem. 2002;277(2):1340–1348. - PubMed
Publication types
MeSH terms
Substances
Grants and funding
LinkOut - more resources
Full Text Sources
Miscellaneous
