Composition of the endothelial glycocalyx and its relation to its thickness and diffusion of small solutes
- PMID: 20600162
- PMCID: PMC2962421
- DOI: 10.1016/j.mvr.2010.06.005
Composition of the endothelial glycocalyx and its relation to its thickness and diffusion of small solutes
Abstract
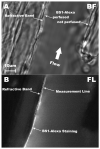
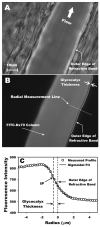
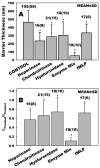
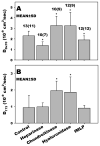
The endothelial glycocalyx is well endowed with the glycosaminoglycans (GAGs) heparan sulfate, chondroitin sulfate and hyaluronan. The current studies aimed to assess the relative contributions of each of these GAGs to the thickness and permeability of the glycocalyx layer by direct enzymatic removal of each using micropipettes to infuse heparinase, chondroitinase and hyaluronidase into post-capillary venules of the intestinal mesentery of the rat. The relative losses of GAGs due to enzymatic removal were compared with stimulated shedding of glycans induced by superfusing the mesentery with 10(-)(7)M fMLP. Thickness of the glycocalyx was assessed by infiltration of the glycocalyx with circulating FITC labeled 70kDa dextran (Dx70) and measuring the distance from the dye front to the surface of the endothelium (EC), which averaged 463nm under control conditions. Reductions in thickness were 43.3%, 34.1% and 26.1% following heparinase, chondroitinase and hyaluronidase, respectively, and 89.7% with a mixture of all three enzymes. Diffusion coefficients of FITC in the glycocalyx were determined using a 1-D diffusion model. By comparison of measured transients in radial intensity of a bolus of FITC with that of a computational model a diffusion coefficient D was obtained. Values of D were obtained corresponding to the thickness of the layer demarcated by Dx70 (D(Dx70)), and a smaller sublayer 173nm above the EC surface (D(173)), prior to and following enzyme infusion and superfusion with fMLP. The magnitude of D(Dx70) was twice that of D(173) suggesting that the glycocalyx is more compact near the EC surface. Chondroitinase and hyaluronidase significantly increased both D(Dx70) and D(173). However, heparinase decreased D(Dx70), and did not induce any significant change for the D(173). These observations suggest that the three GAGs are not evenly distributed throughout the glycocalyx and that they each contribute to permeability of the glycocalyx to a differing extent. The fMLP-induced shedding caused a reduction in glycocalyx thickness (which may increase permeability) and as with heparinase, decreased the diffusion coefficient of solutes (which may decrease permeability). This behavior suggests that the removal of heparan sulfate may cause a collapse of the glycocalyx which counters decreases in thickness by compacting the layer to maintain a constant resistance to filtration.
Copyright © 2010 Elsevier Inc. All rights reserved.
Figures


Similar articles
-
Relative shedding of glycosaminoglycans from the endothelial glycocalyx during inflammation and their contribution to stiffness of the glycocalyx.Biorheology. 2019;56(2-3):191-205. doi: 10.3233/BIR-190225. Biorheology. 2019. PMID: 31707364
-
Inhibition of inflammation induced shedding of the endothelial glycocalyx with low molecular weight heparin.Microvasc Res. 2017 Jul;112:72-78. doi: 10.1016/j.mvr.2017.03.007. Epub 2017 Mar 27. Microvasc Res. 2017. PMID: 28347755 Free PMC article.
-
Shedding of the endothelial glycocalyx in arterioles, capillaries, and venules and its effect on capillary hemodynamics during inflammation.Am J Physiol Heart Circ Physiol. 2011 Dec;301(6):H2235-45. doi: 10.1152/ajpheart.00803.2011. Epub 2011 Sep 16. Am J Physiol Heart Circ Physiol. 2011. PMID: 21926341 Free PMC article.
-
Degradation of the endothelial glycocalyx in clinical settings: searching for the sheddases.Br J Clin Pharmacol. 2015 Sep;80(3):389-402. doi: 10.1111/bcp.12629. Epub 2015 May 22. Br J Clin Pharmacol. 2015. PMID: 25778676 Free PMC article. Review.
-
Role of the Glycocalyx as a Barrier to Leukocyte-Endothelium Adhesion.Adv Exp Med Biol. 2018;1097:51-68. doi: 10.1007/978-3-319-96445-4_3. Adv Exp Med Biol. 2018. PMID: 30315539 Review.
Cited by
-
The structural stability of the endothelial glycocalyx after enzymatic removal of glycosaminoglycans.PLoS One. 2012;7(8):e43168. doi: 10.1371/journal.pone.0043168. Epub 2012 Aug 14. PLoS One. 2012. PMID: 22905223 Free PMC article.
-
Early Onset Preeclampsia Is Associated With Glycocalyx Degradation and Reduced Microvascular Perfusion.J Am Heart Assoc. 2019 Feb 19;8(4):e010647. doi: 10.1161/JAHA.118.010647. J Am Heart Assoc. 2019. PMID: 30764695 Free PMC article.
-
Glycocalyx is critical for blood-brain barrier integrity by suppressing caveolin1-dependent endothelial transcytosis following ischemic stroke.Brain Pathol. 2022 Jan;32(1):e13006. doi: 10.1111/bpa.13006. Epub 2021 Jul 19. Brain Pathol. 2022. PMID: 34286899 Free PMC article.
-
Sphingosine-1-phosphate Maintains Normal Vascular Permeability by Preserving Endothelial Surface Glycocalyx in Intact Microvessels.Microcirculation. 2016 May;23(4):301-10. doi: 10.1111/micc.12278. Microcirculation. 2016. PMID: 27015105 Free PMC article.
-
Therapeutic Effects of Hyaluronic Acid in Bacterial Pneumonia in Ex Vivo Perfused Human Lungs.Am J Respir Crit Care Med. 2019 Nov 15;200(10):1234-1245. doi: 10.1164/rccm.201812-2296OC. Am J Respir Crit Care Med. 2019. PMID: 31390880 Free PMC article.
References
-
- Aruffo A, Stamenkovic I, Melnick M, Underhill CB, Seed B. CD44 is the principal cell surface receptor for hyaluronate. Cell. 1990;61:1303–1313. - PubMed
-
- Bruegger D, Jacob M, Rehm M, Loetsch M, Welsch U, Conzen P, Becker BF. Atrial natriuretic peptide induces shedding of endothelial glycocalyx in coronary vascular bed of guinea pig hearts. Am J Physiol Heart Circ Physiol. 2005;289:H1993–H1999. - PubMed
-
- Chappell D, Hofmann-Kiefer K, Jacob M, Rehm M, Briegel J, Welsch U, Conzen P, Becker BF. TNF-alpha induced shedding of the endothelial glycocalyx is prevented by hydrocortisone and antithrombin. Basic Res Cardiol. 2009;104:78–89. - PubMed
Publication types
MeSH terms
Substances
Grants and funding
LinkOut - more resources
Full Text Sources

