. 2010 Aug 30;191(2):191-200.
doi: 10.1016/j.jneumeth.2010.06.019. Epub 2010 Jun 30.

Cross-correlation of instantaneous amplitudes of field potential oscillations: a straightforward method to estimate the directionality and lag between brain areas

Affiliations

Cross-correlation of instantaneous amplitudes of field potential oscillations: a straightforward method to estimate the directionality and lag between brain areas

Avishek Adhikari et al. J Neurosci Methods. .

Abstract

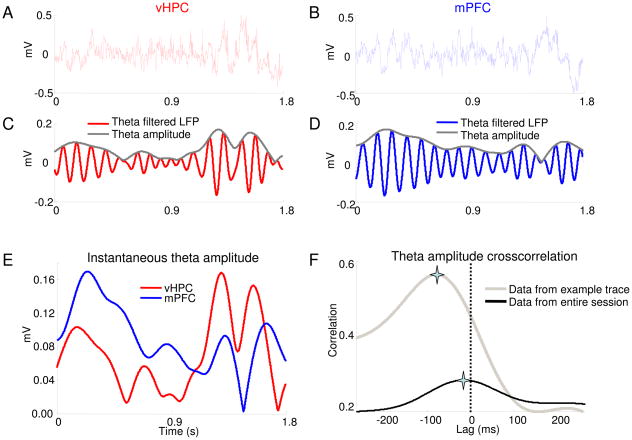
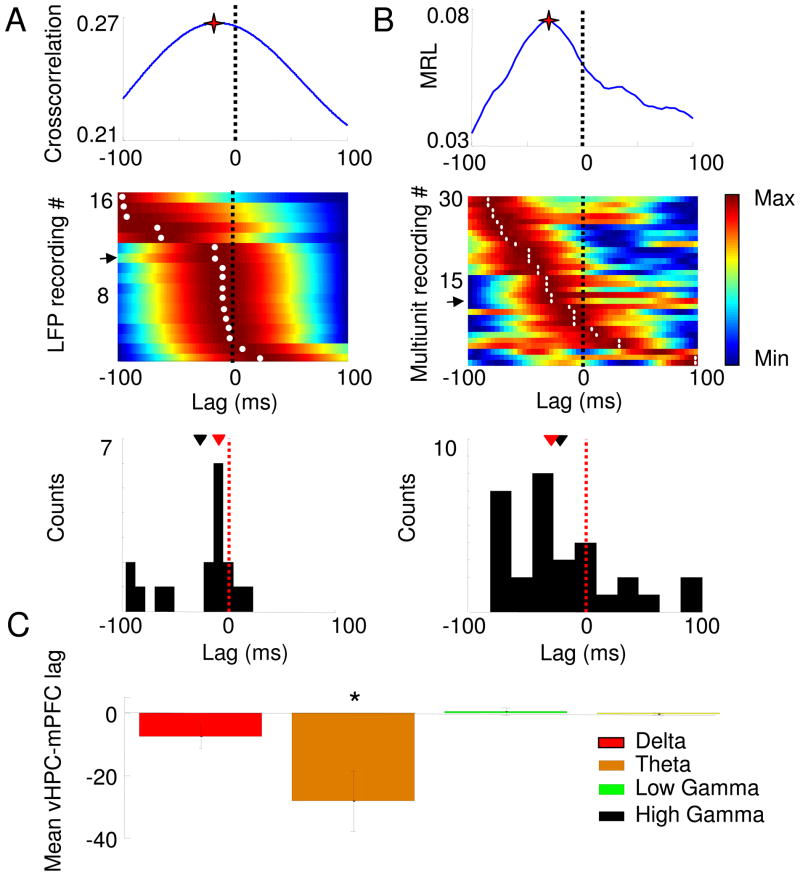
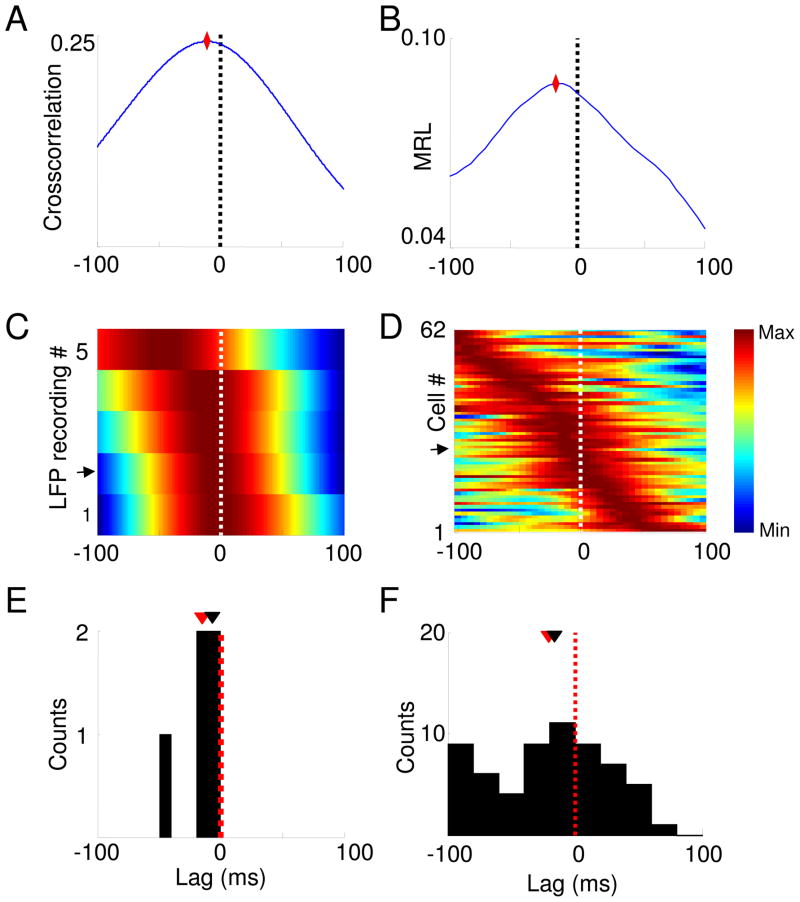
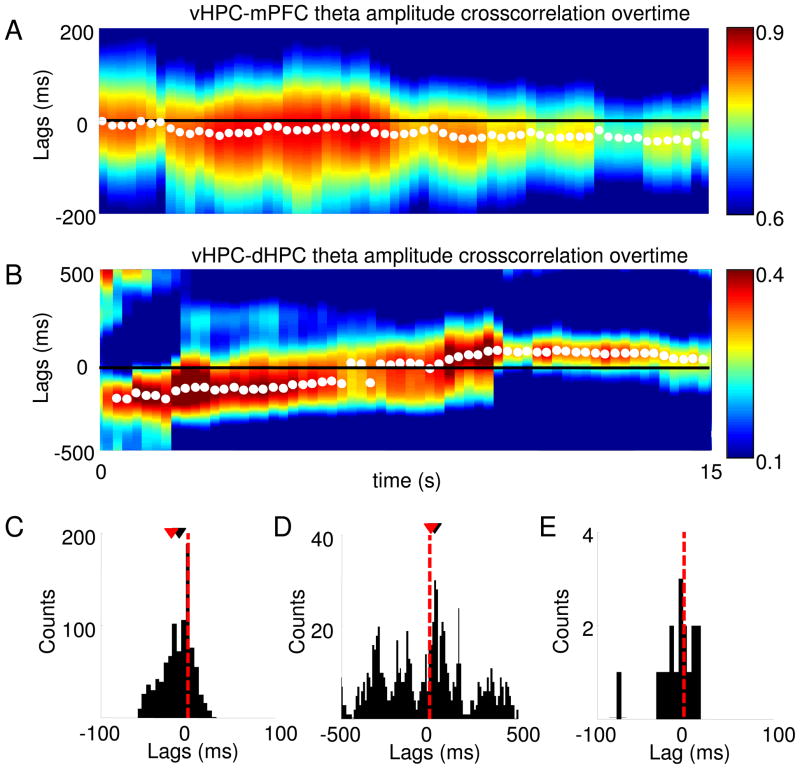
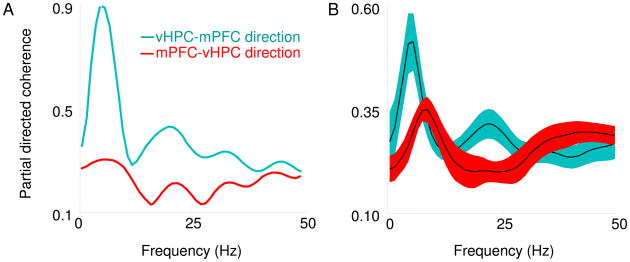
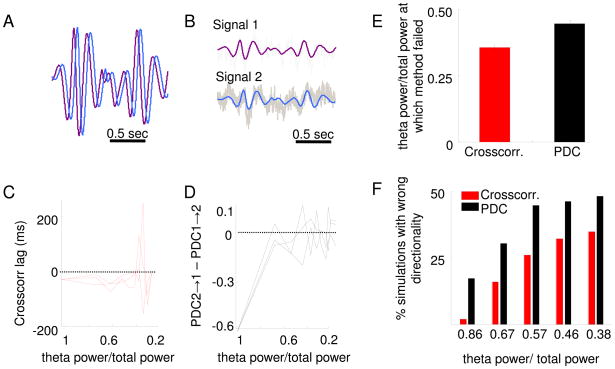
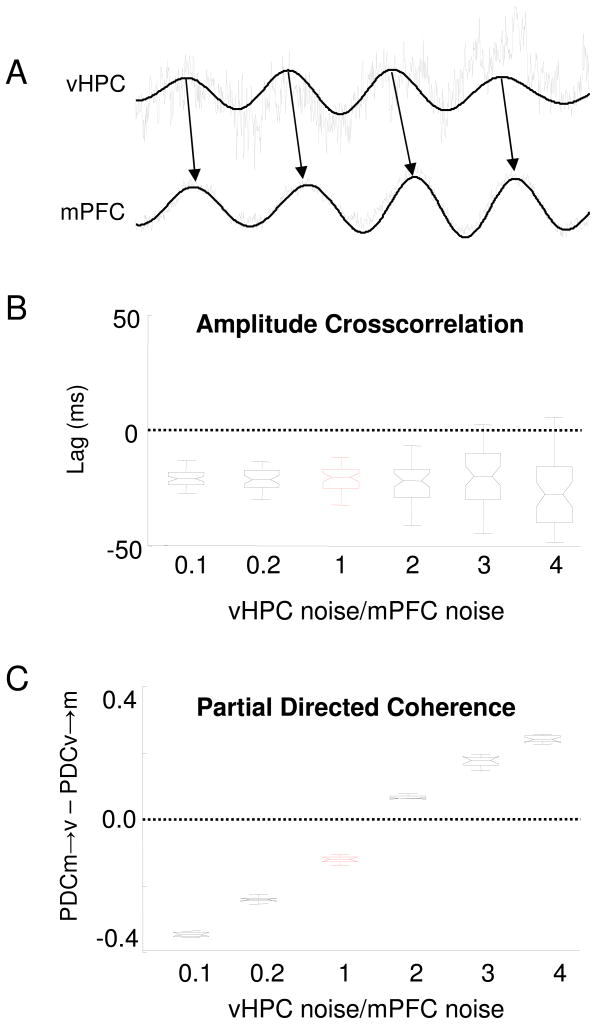
Researchers performing multi-site recordings are often interested in identifying the directionality of functional connectivity and estimating lags between sites. Current techniques for determining directionality require spike trains or involve multivariate autoregressive modeling. However, it is often difficult to sample large numbers of spikes from multiple areas simultaneously, and modeling can be sensitive to noise. A simple, model-independent method to estimate directionality and lag using local field potentials (LFPs) would be of general interest. Here we describe such a method using the cross-correlation of the instantaneous amplitudes of filtered LFPs. The method involves four steps. First, LFPs are band-pass filtered; second, the instantaneous amplitude of the filtered signals is calculated; third, these amplitudes are cross-correlated and the lag at which the cross-correlation peak occurs is determined; fourth, the distribution of lags obtained is tested to determine if it differs from zero. This method was applied to LFPs recorded from the ventral hippocampus and the medial prefrontal cortex in awake behaving mice. The results demonstrate that the hippocampus leads the mPFC, in good agreement with the time lag calculated from the phase locking of mPFC spikes to vHPC LFP oscillations in the same dataset. We also compare the amplitude cross-correlation method to partial directed coherence, a commonly used multivariate autoregressive model-dependent method, and find that the former is more robust to the effects of noise. These data suggest that the cross-correlation of instantaneous amplitude of filtered LFPs is a valid method to study the direction of flow of information across brain areas.


Figures

Fig. 1
Fig. 1
Calculating lags using the amplitude cross-correlation method. (A,B) Simultaneous local field potential recordings obtained from the vHPC (A) and mPFC (B) of a behaving mouse (C,D) Traces in (A) and (B), filtered for theta-frequency activity (7–12 Hz) (red), overlaid with the instantaneous amplitude obtained from the Hilbert transform (grey). (E) The instantaneous amplitudes of the theta-filtered vHPC (red) and mPFC (blue) signals shown in (C) and (D) overlaid for comparison. (F) Cross-correlation of the example amplitude traces shown in (E) (grey). The amplitude cross-correlation from the entire recording session is overlaid (black). The peaks are indicated by stars.
Fig. 2
Fig. 2
Estimation of lags between the vHPC and the mPFC using the amplitude cross-correlation (A) and phase locking (B) methods. Upper Panels: vHPC-mPFC lag estimate from single recording sessions using the amplitude cross-correlation (A), and the effect of shifting the mPFC spike train on the strength of phase-locking (MRL) to vHPC theta oscillations (B). Stars mark the peaks. Middle panels: Normalized color plots of amplitude cross-correlations from 17 recordings (A) and phase-locking shifts from 30 recordings (B). Warmer colors indicate higher cross-correlation peaks or greater phase-locking strength. Each row corresponds to a single LFP (A) or multiunit (B) recording. Rows are arranged according to the peak lag. Arrows mark the rows representing the data shown in the upper panels. The lags at which the cross-correlation (A, middle panel) and phase-locking (B, middle panel) peaks occur are marked with white dots. Lower panels: histograms showing the distribution of peak lags calculated with each method. The distribution of lags is significantly negative for both the amplitude cross-correlation (p<0.05, Wilcoxon rank-sum test, mean lag −28±16.7 ms, median=−9.5 ms, n=17 recordings) and phase-locking (p<0.05 for a paired Wilcoxon’s rank sum test, mean lag −24.5±15.7 ms, median=−32 ms. n=30 recordings). Means and medians of the lag distributions are indicated, respectively, by black and red arrowheads. (C) Lag estimates are frequency-specific. Lags were calculated by cross-correlating the amplitudes after filtering for delta (1–4Hz), theta (7–12 Hz), low gamma (30–50 Hz) and high gamma (50–100 Hz) frequency ranges. Data are presented as means ± 95% confidence intervals. *p<0.01 for a paired Wilcoxon’s rank sum test. In all panels, negative lags indicate that the vHPC leads the mPFC.
Fig. 3
Fig. 3
Estimation of lags between dHPC and mPFC using the amplitude cross-correlation and phase locking methods. (A) dHPC-mPFC lag estimated from a single recording session by crosscorrelating the amplitudes of theta-filtered traces. Note that the peak occurs at a negative lag, indicating that the dHPC leads the mPFC in the theta range. (B) Effect of shifting an mPFC spike train from a single unit on the strength of phase-locking (MRL). The plot shows that this mPFC single unit phase locks best to dHPC theta of the past, in agreement with the directionality shown in (A). Diamonds denote the peaks in both (A) and (B). (C) Normalized color plots of amplitude cross-correlations from 5 recordings and phase-locking shifts from 62 mPFC single units (D). Warmer colors indicate higher cross-correlation peaks or greater phase-locking strength. Each row corresponds to a single LFP (C) or single unit (D) recording. Rows are arranged according to the peak lag. Arrows mark the rows representing the data shown in the upper panels. (E, F) Histograms showing the distribution of peak lags calculated with each method. The distribution of lags is significantly negative for both the amplitude cross-correlation (E) (p<0.05, Wilcoxon rank-sum test, mean lag −15.4 ± 7.9 ms, n=5 recordings) and phase-locking method (F) (p<0.003 for a paired Wilcoxon’s rank sum test, mean lag −20.2 ± 5.8 ms, n=30 recordings). Means and medians of the lag distributions are indicated, respectively, by black and red arrowheads.
Fig. 4
Fig. 4
Application of the amplitude cross-correlation method to bidirectionally-connected areas. (A) A representative 15-second theta amplitude cross-correlation over time for the vHPC-mPFC is shown. Warmer colors correspond to higher cross-correlation values and white points mark the peak of the cross-correlation for each time window. Note that consistent with the existence of a unidirectional monosynaptic projection from the vHPC to the mPFC, the peaks of the cross-correlation fall primarily on negative lags for the vHPC-mPFC cross-correlation, indicating that the vHPC leads the mPFC. (B) same as (A), but for simultaneously recorded vHPC and dHPC traces. In agreement with the existence of bidirectional monosynaptic projections between the vHPC and dHPC, at different time points the cross-correlation peaks at positive or negative lags, presumably reflecting periods in which the vHPC is leading or lagging relative to the dHPC, respectively. (A–B) Cross-correlations were calculated in 8 sec windows with 97% overlap between successive windows. (C) Histogram of the lags at which the cross-correlation peaks occur for the entire 10 minute recording from which the data plotted in (A) was obtained show that the distribution of vHPC-mPFC lags has a negative mean (p<0.005, Wilcoxon’s test), while the distribution of vHPC-dHPC lags (D) is not significantly different from zero (p<0.72, Wilcoxon’s test). (C–D) Each count of the histogram refers to one 8 sec window in which the cross-correlation was computed. The distribution of the mean vHPC-dHPC lag for each animal is shown in (E), and it is not significantly different from zero. Each count in the histogram corresponds to the mean lag of one animal. In (C–E), red and black arrowheads indicate the means and medians of the distribution, respectively.
Fig. 5
Fig. 5
Partial directed coherence indicates that vHPC is leading the mPFC in the theta range. (A) Representative example of PDC on simultaneously recorded vHPC and mPFC LFPs from a single session. Note the prominent peak in the theta range of the PDC in the vHPC to mPFC direction. (B) Average PDC across animals is plotted. Note that in the theta range the predominant direction of flow, as indicated by higher PDC values, is in the vHPC to mPFC direction. Shaded areas indicate S.E.Ms.
Fig. 6
Fig. 6
Partial directed coherence is more sensitive to noise than the amplitude cross-correlation method. (A) Two signals were created from the same two-second segment of vHPC theta-filtered trace. One signal was shifted relative to the other by 28 ms (this is the mean delay between the vHPC and the mPFC calculated by the amplitude cross-correlation method). Thus, the purple trace leads the blue trace with a lag of 28 ms. (B) Pink noise was generated randomly and added to both signals. Ten different levels of noise were added, such the fraction of theta power relative to total power in the signals after adding noise was varied from 1 to 0.2. In the example shown, theta power/total power=0.67. (C)The amplitude cross-correlation method was applied to verify the directionality after adding pink noise to both signals, in 500 simulations in which noise was newly generated, at 10 different amplitudes. Calculation of the lag by the cross-correlation method for three representative simulations is shown. Points with negative lags have the expected directionality. The cross-correlation method fails only when high levels of noise are added, as shown by the points with positive lags with low theta power to total power ratios. Note that the x axis is reversed, such that higher values (high signal to noise ratios) are on the left. (D) Same as in (C), but for PDC calculated from the identical simulations. Correct directionality is reflected as negative values on the y axis. PDC1→2 indicates PDC in the purple trace in A causing the blue trace. Note that this method does not consistently indicate that the purple trace leads the blue trace even after adding only moderate amounts of noise to the signal. (E) Mean noise level at which each method first failed, averaged across 500 simulations. The PDC method on average fails at lower noise levels than the amplitude cross-correlation method (p<0.0001, ranksum test). (F) For five noise levels, the percentage of simulations in which the wrong directionality was calculated is shown. At every noise level PDC had a significantly higher failure rate than the amplitude cross-correlation method (p<0.05, Fisher’s exact test). All PDC values shown are averages across the theta-range.
Fig. 7
Fig. 7
Partial directed coherence, but not the cross-correlation method, is biased if one of the signals has different noise levels than the other signal. (A) Half-second segments of one-minute long signals are shown. Black traces are theta-filtered traces from the vHPC and mPFC. Note that the vHPC leads the mPFC in these traces, as indicated by the black arrows. Grey traces were obtained after adding different levels of pink noise to each of the filtered signals. In this example, the noise added to the vHPC is four-fold greater than the mPFC noise. Across the simulations, the noise added to the mPFC remained constant, while the noise added to the vHPC was varied from 0.1 to 4-fold of the noise added to the mPFC. Noise was generated in six increasing amplitudes in 500 simulations and added to the vHPC. The signals were then analyzed by the amplitude cross-correlation method (B) and PDC (C). (B) Boxplot shows the median lags calculated by the amplitude cross-correlation method after different amounts of noise were added to the vHPC signal while keeping constant the amplitude of the noise added to the mPFC signal. The lag calculated by the amplitude cross-correlation method remains negative, indicating that mPFC follows the vHPC, even when the amount of noise added to the vHPC is greater than the mPFC noise. Boxplots show the mean lag and the 25th and 75th percentiles of the distributions. Whiskers indicate the range. (C) PDC was calculated for the same simulations used in (B) . Correct directionality (vHPC leading) is represented as negative values on the y axis (PDC v→m greater than PDC m→v, where v and m stand for vHPC and mPFC, respectively). PDC indicates that the vHPC leads the vHPC only when the vHPC is equally or less noisy than then the mPFC. Note that PDC consistently indicates that the less noisy signal leads the noisier signal, regardless of the underlying directionality. In (B) and (C), the condition of equivalent noise levels in the two signals (VHPC noise/mPFC noise=1) is shown in red. All PDC values shown are averages across the theta-range.

References

    1. Adhikari A, Topiwala MA, Joshua AG. Synchronized activity between the ventral hippocampus and the medial prefrontal cortex during anxiety. Neuron. In press. - PMC - PubMed
    1. Alonso JM, Martinez LM. Functional connectivity between simple cells and complex cells in cat striate cortex. Nat Neurosci. 1998;1:395–403. - PubMed
    1. Astolfi L, Cincotti F, Mattia D, Marciani MG, Baccala LA, de Vico Fallani F, Salinari S, Ursino M, Zavaglia M, Babiloni F. Assessing cortical functional connectivity by partial directed coherence: simulations and application to real data. IEEE Trans Biomed Eng. 2006;53:1802–12. - PubMed
    1. Baccala LA, Sameshima K. Partial directed coherence: a new concept in neural structure determination. Biol Cybern. 2001;84:463–74. - PubMed
    1. Burwell RD, Witter MP. Basic anatomy of the parahippocampal region in monkeys and rats. Oxford University Press; New York: 2002.

Publication types

LinkOut - more resources