Comparative Study
. 2010 Sep 29;170(1):337-47.
doi: 10.1016/j.neuroscience.2010.06.059. Epub 2010 Jul 1.

Comparison of metabolic and neuropathy profiles of rats with streptozotocin-induced overt and moderate insulinopenia

Affiliations
Comparative Study

Comparison of metabolic and neuropathy profiles of rats with streptozotocin-induced overt and moderate insulinopenia

D Romanovsky et al. Neuroscience. .

Abstract

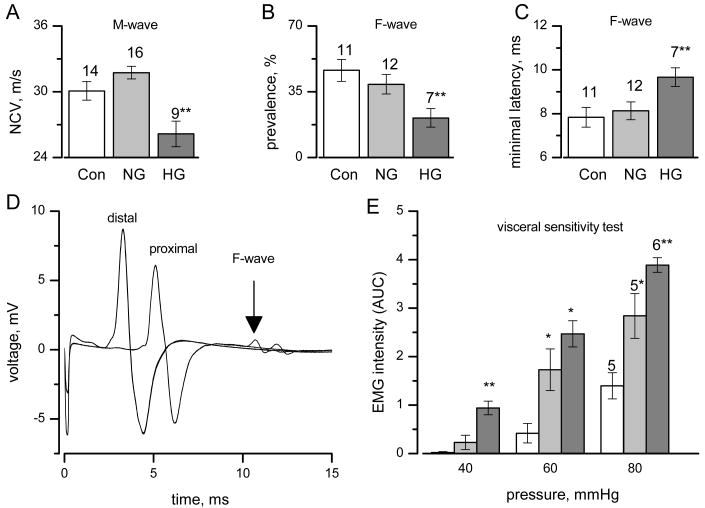
To assess the relative roles of insulinopenia, hyperglycemia and dyslipidemia in pathogenesis of diabetic neuropathy, we compared plasma insulin, glucose and lipid metabolism and peripheral nerve function in rats with streptozotocin (STZ)-induced overt and moderate insulinopenia (hyperglycemic, STZ-HG; random glucose>11 mM and normoglycemic, STZ-NG rats). While being slightly insulinopenic, STZ-NG rats are metabolically not different from control, naive animals, by having normal glucose tolerance and normal levels of plasma glucose, glycated HbA1c, cholesterol and triglycerides. Two weeks following injection of STZ, STZ-HG but not STZ-NG rats had suppressed motor nerve conduction velocity, F-wave prevalence, withdrawal responses to heat and von Frey filament stimuli. In apparent correlation with plasma insulin level, both STZ-HG and -NG rats manifested exaggerated responses in paw pressure and colorectal distension tests. These data suggest that insulinopenia may play a leading role in the diabetic impairment of deep muscle and visceral afferent pathways while hyperglycemia/dyslipidemia may represent a key requirement for the onset and progression of electrophysiological nerve impairment and loss of superficial heat and tactile perception. STZ-NG rats offer a convenient model for the investigation of the short-term effects of insulinopenia on peripheral nerve function.


Figures

FIGURE 1
FIGURE 1
Weight (A), random (B) and peak in FTT (C) glucose of control and STZ-injected rats Number of rats studied indicated by a number next to the symbol. In B and C, horizontal dotted and dashed lines show 7.8 mM and 11 mM random glucose thresholds of clinical pre-diabetes and diabetes, respectively.
FIGURE 2
FIGURE 2
Tests characterizing glucose and lipid metabolism, pancreatic injury and oxidative stress in STZ-NG and -HG rats at two weeks of experiment In panels A - F, open, light grey and dark grey columns represent respectively, control, STZ-NG and STZ-HG groups of rats; number above the column indicates the number of animals studied. Asterisks and double asterisks indicate statistical difference of given group mean from control or from control and from remaining group of animals (p<0.05; two-sample t test). Panels G and H show examples of immunoperoxidase detection of insulin-producing pancreatic islet cells. Adjacent 5 μm thick sections were stained with PGP 9.5 antibodies to characterize the total area of identified islets (G) and with antibodies to insulin to characterize the area of these islets occupied by β-cells (H). Calibration bar is 25 μm
FIGURE 3
FIGURE 3
Pressure pain threshold (A,B) and frequency of withdrawal to brush (C) and 20-g von Frey filament (D) measured in STZ-NG and HG rats at two weeks of experiment. In all panels, number above the column indicates number of animals studied. Open, light and dark grey columns are, respectively control, STZ-NG and STZ-HG rats. Asterisks and double asterisks indicate statistical difference of given group mean from control.
FIGURE 4
FIGURE 4
Heat pain threshold (A) and latency (B) measured after 2 weeks of experiments in control and STZ-injected rats. Opened, light grey and dark grey columns represent respectively, control, STZ-NG and STZ-HG groups of rats; number above the column indicates the number of animals studied. (*, p<0.05; ANOVA)
FIGURE 5
FIGURE 5
Epidermal thickness and innervation in control and STZ-injected rats (2 weeks of experiment) Panels A, B and C (control, STZ-NG and STZ-HG rats, respectively) show a view of skin sections with nerve fibers entering and branching in the epidermis (arrows; PGP 9.5 label). White dotted lines in images mark outer and inner borders of epidermis. Calibration bar is 50 μm. Panels D, E and F, show the results of analysis of mean epidermal thickness (D), IENF (number of fibers per mm of epidermis) and IENF length, expressed as total length of IENF per mm2 of epidermal area (F). Epithelium of STZ-NG rats is thinner than that of control or STZ-NG rats (**). No other between-group statistical significance of studied parameters was detected by ANOVA and Tukey HSD test.
FIGURE 6
FIGURE 6
Nerve conduction studies and assessment of visceral hypersensitivity in STZ-NG and STZ-HG rats. Open, light grey and dark grey columns represent respectively, control, STZ-NG and STZ-HG groups of rats; number above the column indicates a number of animals studied. Asterisks and double asterisks indicate statistical difference of given group mean from control or from control and from remaining group of animals (p<0.05; two-sample t test). Between group difference for data on visceral sensitivity was also supported by repeated measures-ANOVA: F=32.9 (d.f. = 45; p <0.01). Panel D shows example of rat tail M and F-wave recordings induced by the nerve stimulation at the base of the tail (proximal) and more distally along the tail (distal). In this particular example time between positive peaks of M –waves is 1.8 ms, distance between electrodes 5.7 cm and resulting MNCV is 31.7 m/s
FIGURE 7
FIGURE 7
Changes in PPT over time and role of insulinopenia. In A, open, half-filled and filled circles represent control, STZ-NG and STZ-HG rats, respectively. In B and C, open and closed circles represent averages of the results from 2-week-long and 4-week-long experiments, respectively. In all panels, the size of experimental group is given by a number next to the symbol (see text for other details).

References

    1. Bailyes EM, Nave BT, Soos MA, Orr SR, Hayward AC, Siddle K. Insulin receptor/IGF-I receptor hybrids are widely distributed in mammalian tissues: quantification of individual receptor species by selective immunoprecipitation and immunoblotting. Biochem J. 1997;327(Pt 1):209–215. - PMC - PubMed
    1. Bove G. Mechanical sensory threshold testing using nylon monofilaments: the pain field's “tin standard”. Pain. 2006;124:13–17. - PubMed
    1. Bravi MC, Armiento A, Laurenti O, Cassone-Faldetta M, De Luca O, Moretti A, De Mattia G. Insulin decreases intracellular oxidative stress in patients with type 2 diabetes mellitus. Metabolism. 2006;55:691–695. - PubMed
    1. Brussee V, Cunningham FA, Zochodne DW. Direct insulin signaling of neurons reverses diabetic neuropathy. Diabetes. 2004;53:1824–1830. - PubMed
    1. Calcutt NA, Jorge MC, Yaksh TL, Chaplan SR. Tactile allodynia and formalin hyperalgesia in streptozotocin-diabetic rats: effects of insulin, aldose reductase inhibition and lidocaine. Pain. 1996;68:293–299. - PubMed

Publication types