

Fully automated analysis using BRAINS: AutoWorkup
- PMID: 20600977
- PMCID: PMC3827877
- DOI: 10.1016/j.neuroimage.2010.06.047
Fully automated analysis using BRAINS: AutoWorkup
Abstract
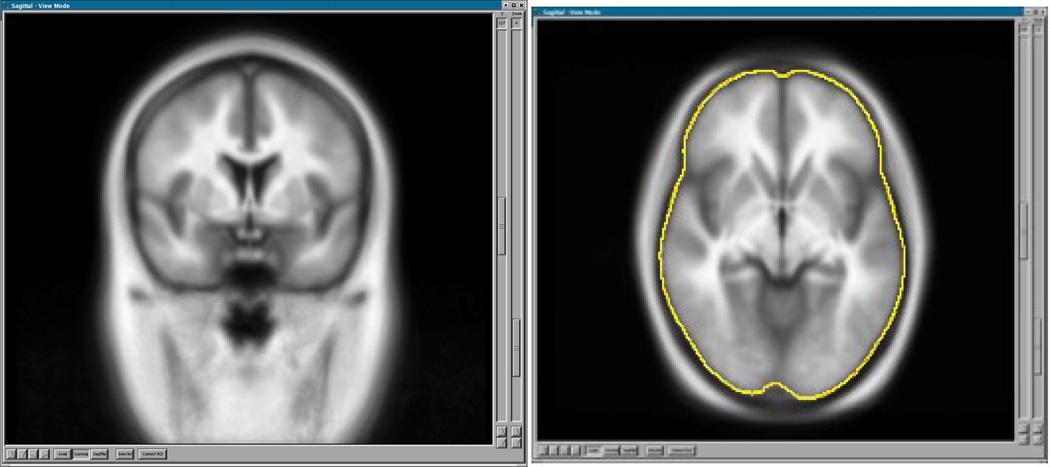
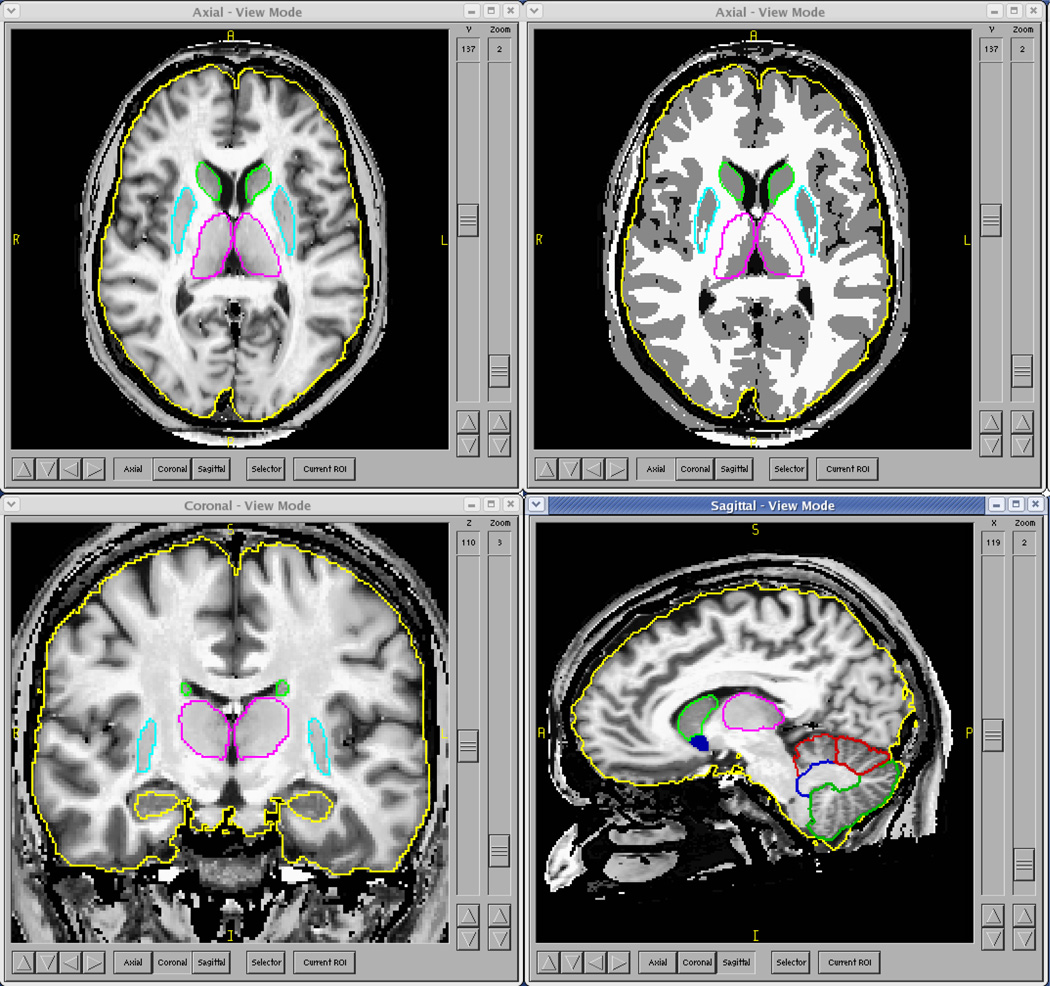
The BRAINS (Brain Research: Analysis of Images, Networks, and Systems) image analysis software has been in use, and in constant development, for over 20 years. The original neuroimage analysis pipeline using BRAINS was designed as a semiautomated procedure to measure volumes of the cerebral lobes and subcortical structures, requiring manual intervention at several stages in the process. Through use of advanced image processing algorithms the need for manual intervention at stages of image realignment, tissue sampling, and mask editing have been eliminated. In addition, inhomogeneity correction, intensity normalization, and mask cleaning routines have been added to improve the accuracy and consistency of the results. The fully automated method, AutoWorkup, is shown in this study to be more reliable (ICC ≥ 0.96, Jaccard index ≥ 0.80, and Dice index ≥ 0.89 for all tissues in all regions) than the average of 18 manual raters. On a set of 1130 good quality scans, the failure rate for correct realignment was 1.1%, and manual editing of the brain mask was required on 4% of the scans. In other tests, AutoWorkup is shown to produce measures that are reliable for data acquired across scanners, scanner vendors, and across sequences. Application of AutoWorkup for the analysis of data from the 32-site, multivendor PREDICT-HD study yield estimates of reliability to be greater than or equal to 0.90 for all tissues and regions.
Copyright © 2010 Elsevier Inc. All rights reserved.
Figures
References
-
- Agartz I, Okuguwa G, Nordstrom M, Greitz D, Magnotta V, Sedvall G. Reliability and reproducibility of brain tissue volumetry from segmented MR scans. Eur. Arch. Psychiatry Clin. Neurosci. 2001;251:255–261. - PubMed
-
- Andreasen NC, Rajarethinam R, Cizadlo T, Arndt S, Swayze VW, 2nd, Flashman LA, O'Leary DS, Ehrhardt JC, Yuh WT. Automatic atlas-based volume estimation of human brain regions from MR images. J. Comput. Assist. Tomogr. 1996;20:98–106. - PubMed
-
- Block RI, O'Leary DS, Ehrhardt JC, Augustinack JC, Ghoneim MM, Arndt S, Hall JA. Effects of frequent marijuana use on brain tissue volume and composition. Neuroreport. 2000;11:491–496. - PubMed
-
- Christensen GE, Johnson HJ, Vannier MW. Synthesizing average 3D anatomical shapes. Neuroimage. 2006;32:146–158. - PubMed
Publication types
MeSH terms
Grants and funding
LinkOut - more resources
Full Text Sources
