. 2010 Dec;53(4):1208-24.
doi: 10.1016/j.neuroimage.2010.06.040. Epub 2010 Jun 30.

Nearly automatic segmentation of hippocampal subfields in in vivo focal T2-weighted MRI

Affiliations

Nearly automatic segmentation of hippocampal subfields in in vivo focal T2-weighted MRI

Paul A Yushkevich et al. Neuroimage. 2010 Dec.

Abstract

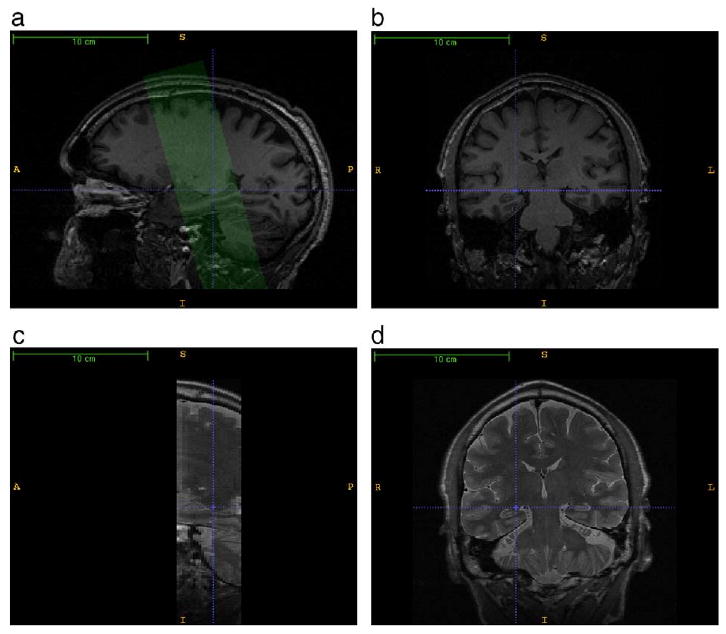
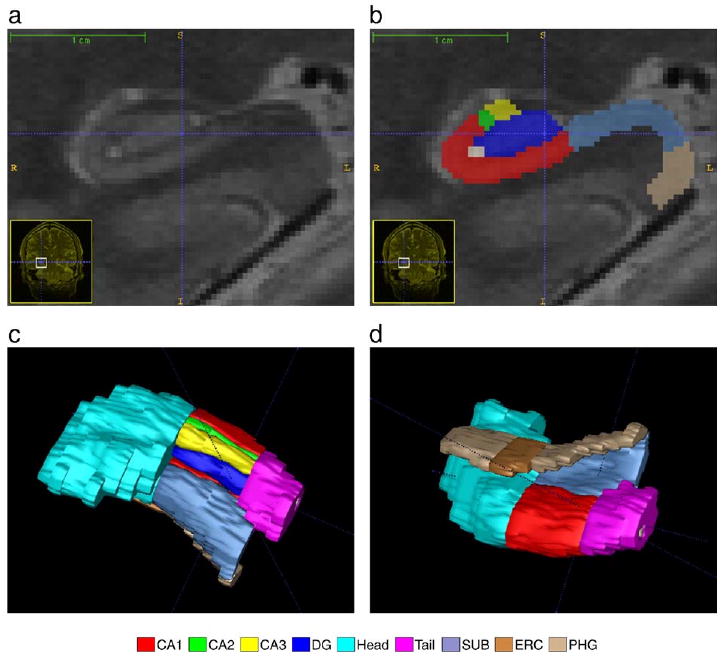
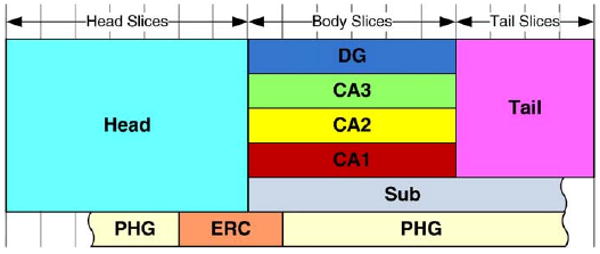
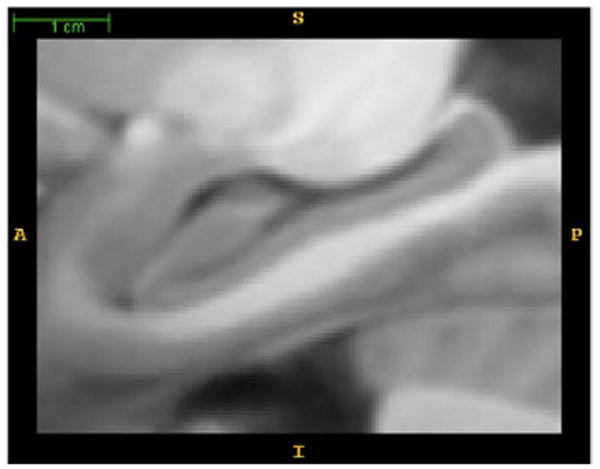
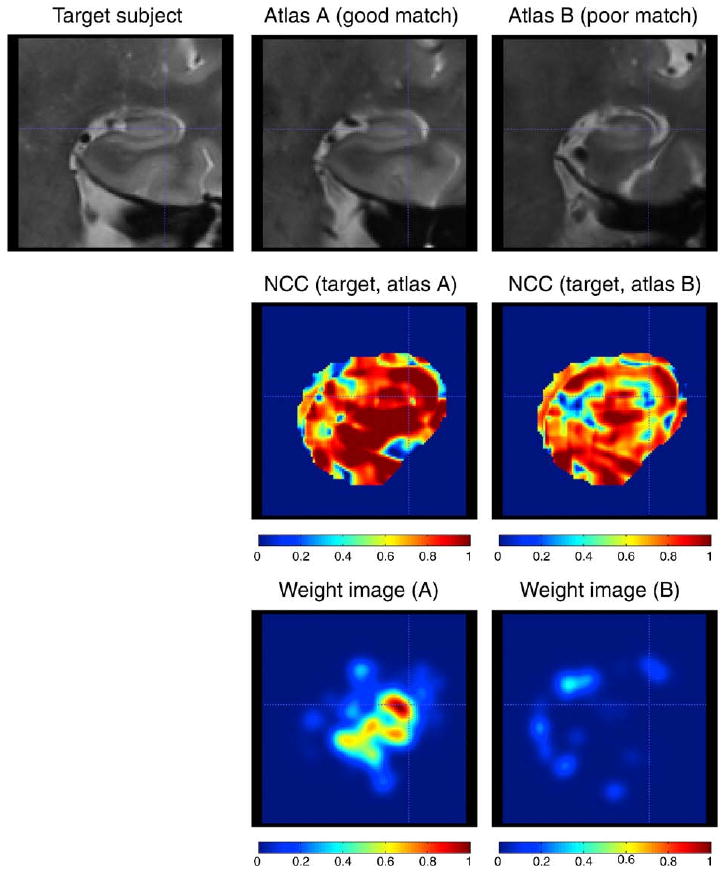
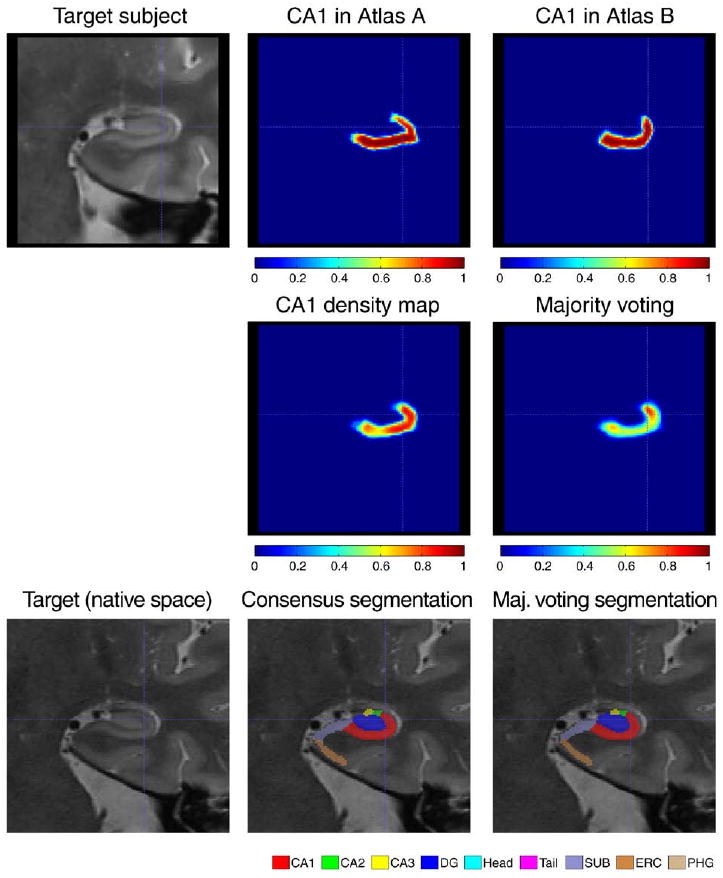
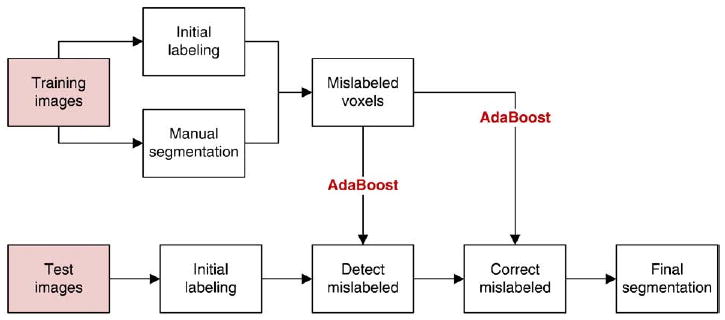
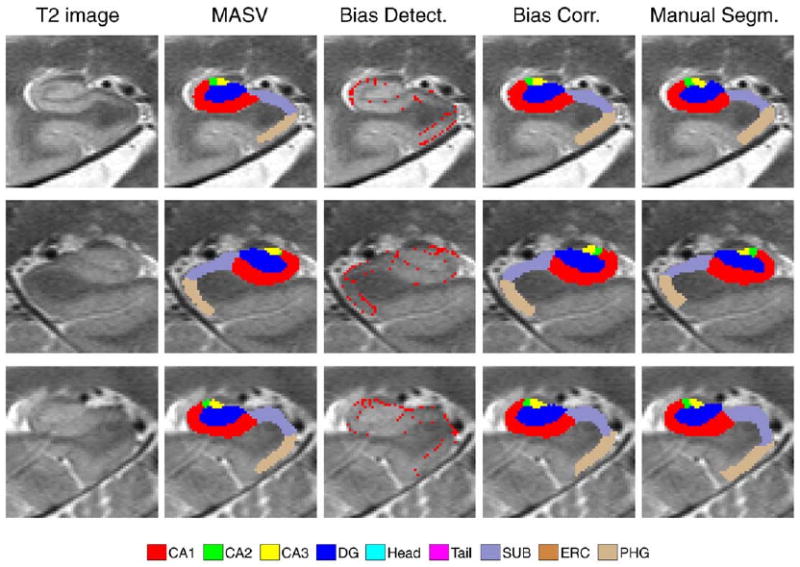
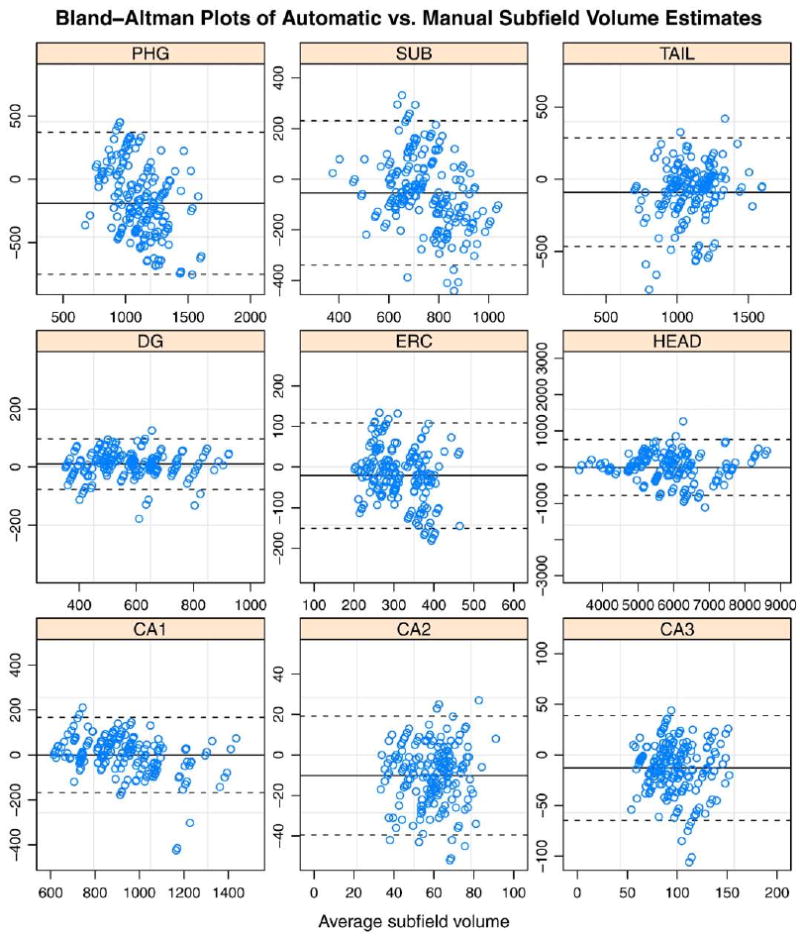
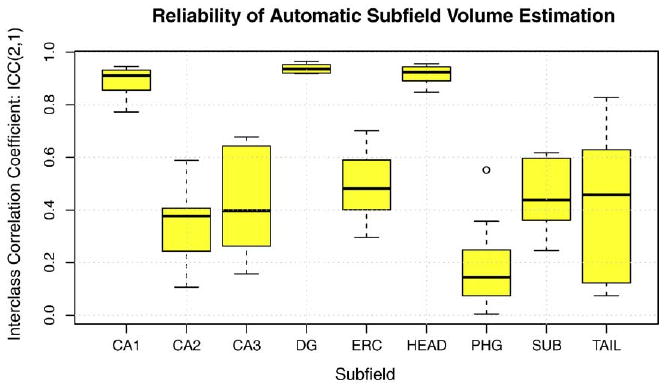
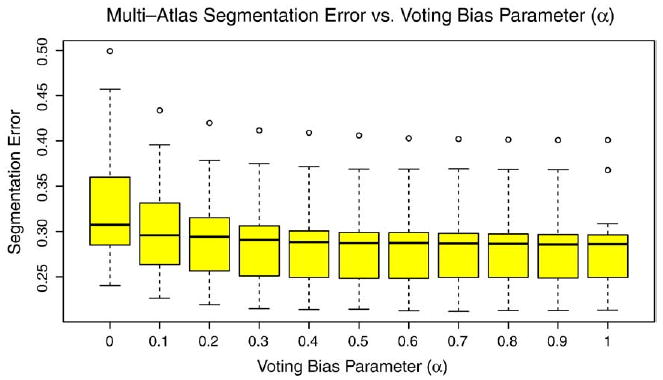
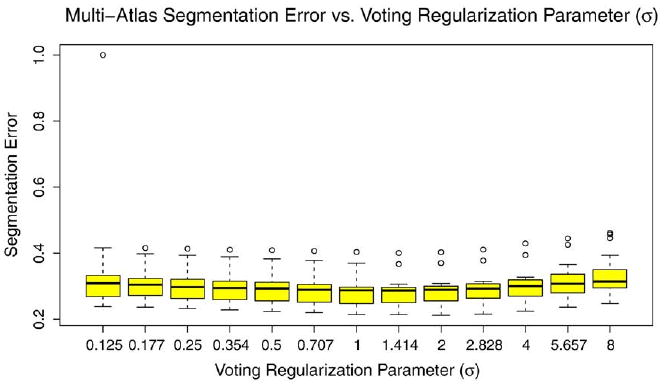
We present and evaluate a new method for automatically labeling the subfields of the hippocampal formation in focal 0.4 × 0.5 × 2.0mm(3) resolution T2-weighted magnetic resonance images that can be acquired in the routine clinical setting with under 5 min scan time. The method combines multi-atlas segmentation, similarity-weighted voting, and a novel learning-based bias correction technique to achieve excellent agreement with manual segmentation. Initial partitioning of MRI slices into hippocampal 'head', 'body' and 'tail' slices is the only input required from the user, necessitated by the nature of the underlying segmentation protocol. Dice overlap between manual and automatic segmentation is above 0.87 for the larger subfields, CA1 and dentate gyrus, and is competitive with the best results for whole-hippocampus segmentation in the literature. Intraclass correlation of volume measurements in CA1 and dentate gyrus is above 0.89. Overlap in smaller hippocampal subfields is lower in magnitude (0.54 for CA2, 0.62 for CA3, 0.77 for subiculum and 0.79 for entorhinal cortex) but comparable to overlap between manual segmentations by trained human raters. These results support the feasibility of subfield-specific hippocampal morphometry in clinical studies of memory and neurodegenerative disease.


Figures

Fig. 1
Fig. 1
A comparison of the T1-weighted and T2-weighted MRI used by the automatic segmentation algorithm. a. A sagittal slice through the right hippocampal formation in the T1-weighted image. The green overlay illustrates the position and orientation of the T2-weighted image, which is oblique relative to the T1-weighted image. b. A coronal slice in the T1-weighted image; the dashed blue crosshairs point to the same voxel as in the sagittal slice. c. A sagittal slice through the T2-weighted image. d. A coronal slice through the T2-weighted image. The T2-weighted image offers greater contrast between hippocampal layers and greater in-slice resolution. In particular, a well-pronounced hypointense band formed by the innermost layers of the cornu Ammonis is apparent in both left and right hippocampi. However, the T2-weighted image has low resolution in the slice direction.
Fig. 2
Fig. 2
A close-up view of the right hippocampal formation in the image in Fig. 1. a. The coronal slice of the T2-weighted image, zoomed in by a factor of 10. b. Manual segmentation of the hippocampal formation overlaid on the coronal slice c,d. Three-dimensional rendering of the manual segmentation viewed from superior and inferior directions, respectively.
Fig. 3
Fig. 3
Diagram of the subdivision of the coronal slices in T2-weighted MRI into hippocampal head, body and tail. The vertical lines indicate coronal slices. The colored rectangles describe the subfields included in the manual segmentation protocol. Subfields CA1-3 and DG are defined in body slices; SUB is defined in body and tail slices; PHG is not restricted to specific slices, but the portion of the PHG belonging to three slices near the head-body boundary is designated ERC. The scale of the subfields in this diagram does not correspond to their actual volume.
Fig. 4
Fig. 4
A sagittal slice of the reference space extracted from the T1 population template. This image is the average of 32 subject T1-weighted images warped to the template space and resampled at 0.4 mm isotropic resolution.
Fig. 5
Fig. 5
Illustration of the similarity-weighted voting procedure. Top row: coronal slice from the target T2-weighted image warped to the reference space, and coronal slices from two “atlases” warped to the target image using deformable registration. Middle row: Maps of normalized cross-correlation (Ci,j in the text) between the target image and warped atlas images. The binary mask used during registration is applied to the cross-correlation images. Bottom row: weight images (Wi,j) derived for each atlas by ranking the cross-correlation maps, applying an inverse exponential, and smoothing (see text for details). Larger weight values should indicate greater similarity between the atlas and the target image. Atlas A is better registered to the target image than Atlas B, so the cross-correlation map and weight image for Atlas A have greater values than for Atlas B. Continued in Fig. 6.
Fig. 6
Fig. 6
Illustration of the similarity-weighted voting procedure (continued from Fig. 5). Top row: CA1 segmentations from atlases A and B warped to the target image. Middle row, left: CA1 density map ( Dil in the text) computed as the weighted sum of warped CA1 segmentations from all atlases (weights Wi,j illustrated in Fig. 5). Middle row, right: density map computed using simple majority voting, i.e., equal weight averaging of warped labels from all atlases. The density map produced using weighted voting has greater density throughout CA1. Bottom Row: coronal slice in the target image, in its native image space, with overlaid consensus segmentations produced using similarity-weighted and majority voting. The consensus segmentation is the final output of MASV.
Fig. 7
Fig. 7
Flowchart of the segmentation refinement algorithm. In the training set, initial segmentation results from MASV are compared to ground truth manual segmentations, and a classifier is trained to recognize mislabeled voxels. Additionally, classifiers are trained to assign the correct label to each mislabeled voxel. MASV is also applied to images in the test set. Its results are refined by using the first type of classifier to detect voxels mislabeled by MASV and by using the second type of classifier to assign a correct label to these voxels.
Fig. 8
Fig. 8
Examples of automatic and manual segmentations in three target subjects. Left HF is shown in subjects 1 and 3; right HF is shown in subject 2. Shown from left to right are (1) detail of the coronal slice of the T2-weighted image (in native image space); (2) result of multi-atlas segmentation with similarity-weighted voting (MASV); (3) voxels declared “mislabeled” by the learning-based bias detection algorithm; (4) final segmentation, after applying learning-based bias correction to relabel “mislabeled” voxels; (5) manual segmentation.
Fig. 9
Fig. 9
Bland-Altman plots comparing automatic volume estimates to manual volume estimates by rater JP for each subfield. Each point corresponds to a segmentation of one of the two hemispheres in one of Ntest test subjects in one of the Nexp cross-validation experiments. The difference between automatic and manual estimates is plotted against their average. The solid horizontal line corresponds to the average difference, and the dashed lines are plotted at average ±1.96 standard deviations of the difference.
Fig. 10
Fig. 10
Agreement between automatically and manually derived estimates of hippocampal subfield volume. For each subfield, the box-whisker plot shows the range of ICC coefficients obtained from 10 cross-validation experiments (‘boxes’ are drawn between lower and upper quartiles; 'whiskers' indicate minimum and maximum values, minus the outliers, indicated by circles; the bold line represents the median). Large values of ICC indicate better agreement. See text for details.
Fig. 11
Fig. 11
Segmentation error vs. voting bias parameter α.
Fig. 12
Fig. 12
Segmentation error vs. voting regularization parameter σ.

References

    1. Aljabar P, Heckemann RA, Hammers A, Hajnal JV, Rueckert D. Multi-atlas based segmentation of brain images: atlas selection and its effect on accuracy. Neuroimage. 2009;46:726–738. - PubMed
    1. Amaral D, Lavenex P. Hippocampal neuroanatomy. In: Andersen P, Morris R, Amaral D, Bliss T, O'Keefe J, editors. The Hippocampus Book. Oxford University Press; 2007. pp. 37–114.
    1. Apostolova LG, Dinov ID, Dutton RA, Hayashi KM, Toga AW, Cummings JL, Thompson PM. 3D comparison of hippocampal atrophy in amnestic mild cognitive impairment and Alzheimer's disease. Brain. 2006;129:2867–2873. - PubMed
    1. Arnold SE, Franz BR, Gur RC, Gur RE, Shapiro RM, Moberg PJ, Trojanowski JQ. Smaller neuron size in schizophrenia in hippocampal subfields that mediate cortical-hippocampal interactions. Am J Psychiatry. 1995;152:738–748. - PubMed
    1. Artaechevarria X, Munoz-Barrutia A, Ortiz-de Solorzano C. Combination strategies in multi-atlas image segmentation: application to brain MR data. IEEE Trans Med Imaging. 2009;28:1266–1277. - PubMed

Publication types