Review
. 2010 Jul;72(5):1205-17.
doi: 10.3758/APP.72.5.1205.

Current perspectives in medical image perception

Affiliations
Review

Current perspectives in medical image perception

Elizabeth A Krupinski. Atten Percept Psychophys. 2010 Jul.

Abstract

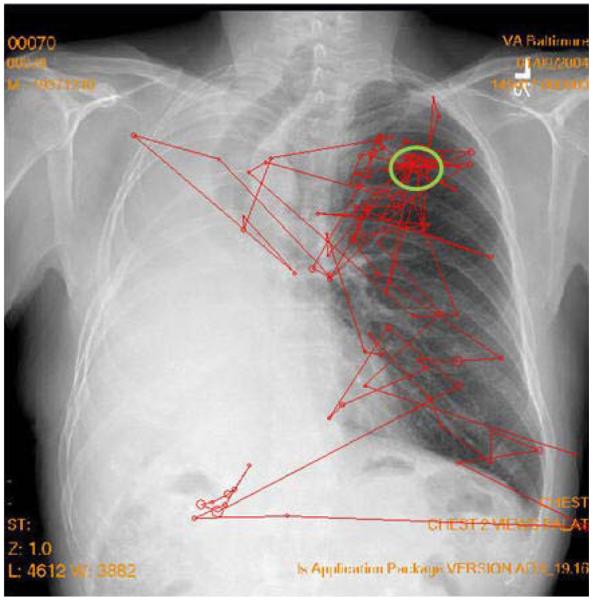
Medical images constitute a core portion of the information a physician utilizes to render diagnostic and treatment decisions. At a fundamental level, this diagnostic process involves two basic processes: visually inspecting the image (visual perception) and rendering an interpretation (cognition). The likelihood of error in the interpretation of medical images is, unfortunately, not negligible. Errors do occur, and patients' lives are impacted, underscoring our need to understand how physicians interact with the information in an image during the interpretation process. With improved understanding, we can develop ways to further improve decision making and, thus, to improve patient care. The science of medical image perception is dedicated to understanding and improving the clinical interpretation process.


Figures

Figure 1
Figure 1
A typical projection X-ray chest image with two marks made by a radiologist indicating locations of suspected tumors. The upper circle represents a true tumor (true positive), and the bottom circle represents a false positive (false alarm) report (not a true tumor).
Figure 2
Figure 2
A portion of a mammogram in which a malignant mass (white blob within the circle) has developed, clearly illustrating how lesions grow within the existing anatomy. The other white structures in the image represent normal breast tissue, illustrating how normal and abnormal structures often look very similar.
Figure 3
Figure 3
A typical CT slice through the chest. Imagine the patient lying flat on a table, so that the bottom of the image is his or her back and the white structures that look like a “Y” are the spine. The black areas in the center with the white speckles are the lungs, and the white speckles are blood vessels going through the plane of the paper. The gray outer areas represent mostly muscle and body fat.
Figure 4
Figure 4
Example of a search error. The tumor is in the large circle on the lung on the right. The other circles indicate the locations where the eyes landed and dwell time was built up. The lines show the eyetracking record. Larger circles indicate longer dwell times. The lines indicate the order in which the fixation clusters were generated. The observer never fixated the tumor and did not report it.
Figure 5
Figure 5
Example of a decision error. The tumor is in the large oval near the top of the lung on the right. There are numerous fixations on the tumor, but the observer failed to report the tumor. The right lung (left side of the image) is missing. Since the task was to search for lung tumors, search on that side was minimal.
Figure 6
Figure 6
Typical search pattern of someone who detects the lesion target very quickly. The observer started on the left side of the image, then detected the nodule on the right side and quickly scanned to that side with a single fixation on the tumor before terminating search and reporting the tumor as present. The total search time was 2.4 sec.
Figure 7
Figure 7
An observer in the eye position recording setup.
Figure 8
Figure 8
A typical search pattern of a radiologist searching a chest image for nodules. The circles represent fixations (where the size reflects dwell: increased size = longer dwell), and the lines indicate the order in which the fixations were generated.
Figure 9
Figure 9
Typical search pattern of an experienced pathologist.
Figure 10
Figure 10
Typical search pattern of a pathology resident.
Figure 11
Figure 11
A typical pathology image with preferred zoom locations marked by the pathologists (dark gray), residents (medium gray), and postsophomore fellows (light gray). Triangles indicate the first location preferred, squares the second preferred, and circles the third preferred. The single dot on the right is considered a “sporadic” location; the clusters of dots on the left piece of tissue are all considered “common” locations.
Figure 12
Figure 12
Mean Swedish Occupational Fatigue Inventory and Simulator Sickness Questionnaire (SSQ) ratings for faculty and residents early and late in the day.

References

    1. Abbey CK, Eckstein MP. Observer models as a surrogate to perception experiments. In: Samei E, Krupinski E, editors. The handbook of medical image perception and techniques. Cambridge University Press; Cambridge: 2010. pp. 240–250.
    1. Åhsberg E. Dimensions of fatigue in different working populations. Scandinavian Journal of Psychology. 2000;41:231–241. - PubMed
    1. Barrett HH, Myers KJ. Foundations of image science. Wiley; Hoboken, NJ: 2003.
    1. Barten PGJ. In: Rogowitz BE, editor. Physical model for the contrast sensitivity of the human eye; Proceedings of SPIE: Vol. 1666. Human vision, visual processing, and digital display III; San Jose, CA: SPIE Press. 1992.pp. 57–72.
    1. Barten PGJ. Contrast sensitivity of the human eye and its effects on image quality. SPIE Press; Bellingham, WA: 1999.

Publication types

MeSH terms

LinkOut - more resources