. 2010 Jul;17(7):909-15.
doi: 10.1038/nsmb.1838. Epub 2010 Jul 4.

iCLIP reveals the function of hnRNP particles in splicing at individual nucleotide resolution

Affiliations

iCLIP reveals the function of hnRNP particles in splicing at individual nucleotide resolution

Julian König et al. Nat Struct Mol Biol. 2010 Jul.

Abstract

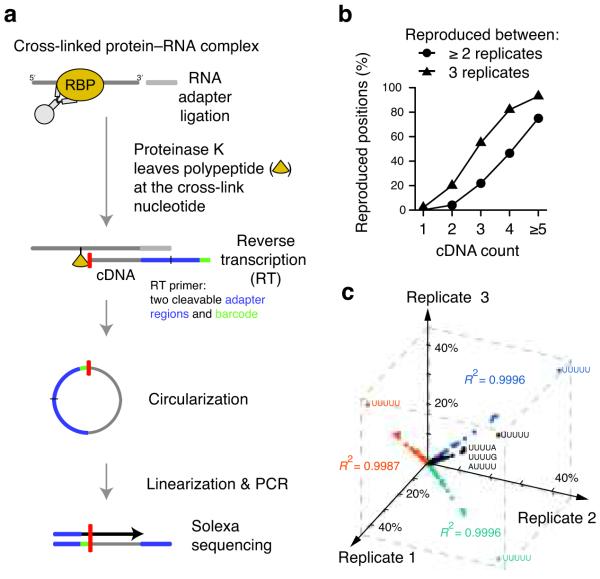
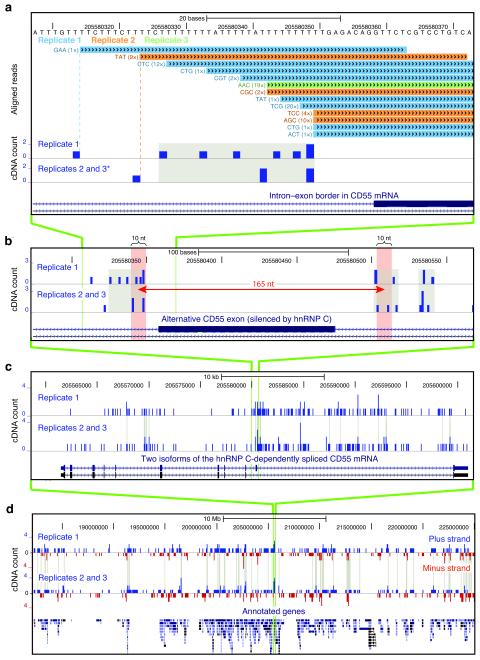
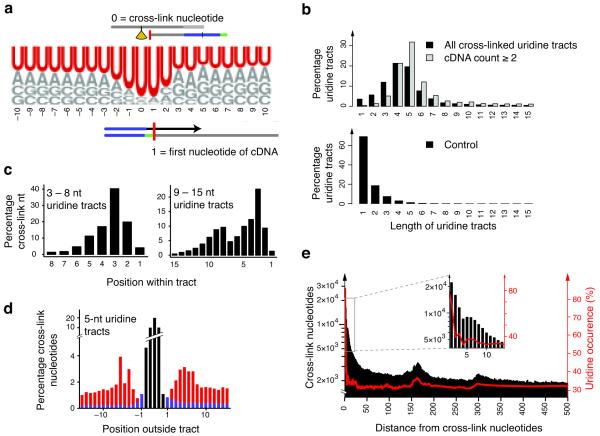
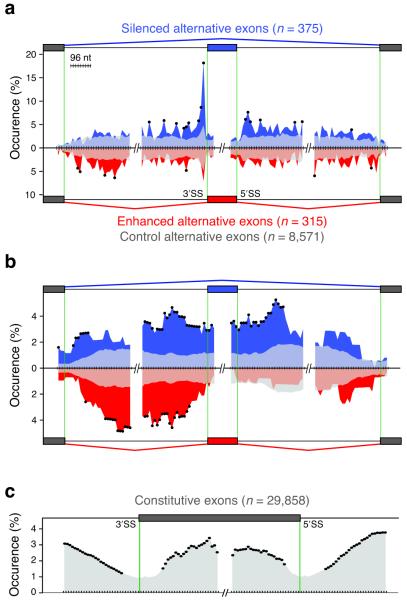
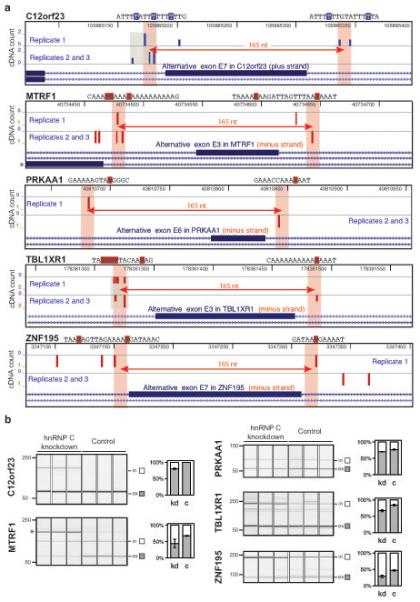
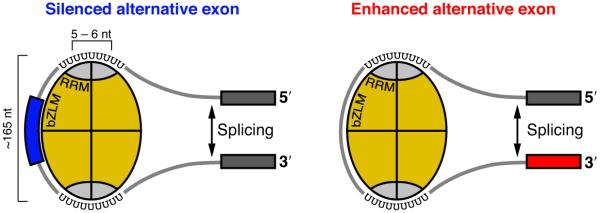
In the nucleus of eukaryotic cells, nascent transcripts are associated with heterogeneous nuclear ribonucleoprotein (hnRNP) particles that are nucleated by hnRNP C. Despite their abundance, however, it remained unclear whether these particles control pre-mRNA processing. Here, we developed individual-nucleotide resolution UV cross-linking and immunoprecipitation (iCLIP) to study the role of hnRNP C in splicing regulation. iCLIP data show that hnRNP C recognizes uridine tracts with a defined long-range spacing consistent with hnRNP particle organization. hnRNP particles assemble on both introns and exons but remain generally excluded from splice sites. Integration of transcriptome-wide iCLIP data and alternative splicing profiles into an 'RNA map' indicates how the positioning of hnRNP particles determines their effect on the inclusion of alternative exons. The ability of high-resolution iCLIP data to provide insights into the mechanism of this regulation holds promise for studies of other higher-order ribonucleoprotein complexes.


Figures

Figure 1
Figure 1
iCLIP identifies hnRNP C cross-link nucleotides on RNAs. (a) Schematic representation of the iCLIP protocol. After UV irradiation, the covalently linked RNA is co-immunoprecipitated with the RNA-binding protein (RBP) and ligated to an RNA adapter at the 3′ end. Proteinase K digestion leaves a covalently bound polypeptide fragment on the RNA that causes premature truncation of reverse transcription (RT) at the cross-link site. The red bar indicates the last nucleotide added during reverse transcription. Resulting cDNA molecules are circularized, linearized, PCR-amplified and subjected to high-throughput sequencing. The first nucleotides of each sequence contain the barcode followed by the nucleotide where cDNAs truncated during reverse transcription. (b) Reproducibility of cross-link nucleotide positions. Percentage of cross-link nucleotides with a given cDNA count that were identified in at least two (circles) or all three experiments (triangles) are shown. The percentage of reproduced cross-link nucleotides increased with the incidence of hnRNP C cross-linking (cDNA count). (c) Reproducibility of sequence composition at cross-link nucleotides. Frequencies of pentanucleotides overlapping with cross-link nucleotides are shown for the three replicate experiments (R2 = 0.9996, R2 = 0.9987 and R2 = 0.9996) with the sequence shown for the four most highly enriched pentanucleotides. 42% of cross-link nucleotides overlap with UUUUU in all three replicate experiments.
Figure 2
Figure 2
The genomic location of hnRNP C cross-link nucleotides. (a) Conversion of mapped iCLIP sequence reads into cDNA count values. Genomic sequence is shown above the color-coded positions of cDNA sequences from replicate experiments, preceded by the associated random barcode and the number of sequenced PCR duplicates (given in brackets). In the lower panel, a ‘cDNA count’ was assigned to the upstream ‘cross-link nucleotide’. Cross-link nucleotides within filtered clusters are highlighted in grey. The position of an alternative exon in CD55 mRNA is shown at the bottom. Modified image of the UCSC genome browser (human genome, version hg18, chromosome 1, nucleotides 205,580,308 to 205,580,373). * Due to space limitations, replicates 2 and 3 were merged into one lane. (b) Long-range spaced cross-link nucleotides flank the alternative exon in CD55 pre-mRNA. A distance of 165 nucleotides is marked by a red arrow with red shaded bars on either side representing ten nucleotide surrounding intervals. (c) Cross-link nucleotides are present along the entire length of CD55 pre-mRNA and accumulate around the alternative exon. Clustered cross-link nucleotides are indicated with grey lines. Annotation below shows position of exons in two alternative transcripts. (d) Global view of cross-link nucleotides on chromosome 11 (nucleotides 182,200,000 to 225,000,000). cDNA counts corresponding to positions in plus and minus strand transcripts are shown in blue and red, respectively. Gene annotations are given below. Cross-linking to individual genes and strand specificity are reproduced between replicates.
Figure 3
Figure 3
hnRNP C binds uridine tracts with a defined spacing. (a) Weblogo showing base frequencies of cross-link nucleotides and 20 nucleotides of surrounding genomic sequence. Positions 0 and 1 correspond to cross-link nucleotide and first position of cDNA sequence, respectively. For comparison, the background distribution of bases within transcribed regions is: U, 30.3%, A, 27.7%, G, 21.4% and C, 20.6%. (b) Length distribution of uridine tracts harboring cross-link nucleotides. The percentage of tracts of a certain length is given relative to all bound tracts. Panels compare all cross-link nucleotides (black) to those with a cDNA count of 2 or higher (grey, top), and length distribution of tracts within the transcriptome as control (bottom). (c) Positioning of cross-link nucleotides within uridine tracts. Positions were summarized over shorter (3 – 8 uridines) and longer tracts (9 – 15 uridines) aligned at their 3′ ends. Longer tracts contain two peaks at a defined spacing of 5 – 6 nucleotides (Supplementary Fig. 6b). (d) Binding neighborhood of five-nucleotide uridine tracts (black). Occurrence of cross-link nucleotides at a given position is given as a fraction of all positions. Cross-link nucleotides within flanking uridine tracts of at least three uridines are shown in red, and those remaining in blue. (e) Long-range spacing of cross-link nucleotides. Distances to all downstream cross-link nucleotides were summarized (black). Uridine densities at the same distances are superimposed (red). Inlay shows an enlarged region of the graph. Increased occurrence of cross-link nucleotides coincided with peaks in uridine density at 165 and 300 nucleotides distance.
Figure 4
Figure 4
The RNA map relates hnRNP particle positioning to splicing regulation. (a) The RNA map of cross-link sites within regulated pre-mRNAs. Positioning of cross-link nucleotides was assessed at exon–intron boundaries of alternative (375 silenced, blue; 315 enhanced, red; 8,571 control alternative exons, grey; regions of overlap are shown as lighter shades of blue/red) and flanking constitutive exons. “Occurrence (%)” indicates the percentage of exons that have at least one cross-link nucleotide within a given window. Black dots mark significant enrichment of regulated exons containing cross-link nucleotides within a given window relative to control alternative exons (p value < 0.01 by Fisher’s Exact test). Silenced alternative exons show strong enrichment of cross-link nucleotides proximal to the 3′ and the 5′ splice sites (3′SS and 5′SS). (b) The RNA map of hnRNP particles on regulated pre-mRNAs. Positioning of regions intervening cross-link nucleotides with defined 160 – 170 nucleotide spacing was analyzed as in Fig. 4a. Silenced alternative exons show incorporation of the entire regulated exon into hnRNP particles, whereas particle incorporation is confined to the preceding intron at enhanced alternative exons. (c) The RNA map of hnRNP particles at constitutive exons. Positioning of regions intervening the cross-link nucleotides with a spacing of 160 – 170 nucleotides was assessed at exon–intron boundaries of constitutive exons (29,858 exons analyzed as in Fig. 4a). Splice sites show decreased incorporation into hnRNP particles.
Figure 5
Figure 5
iCLIP data predict exons that are silenced by hnRNP C. (a) Genomic location of hnRNP C cross-link nucleotides surrounding silenced exons that were predicted from iCLIP data. Five exons that are flanked by cross-link nucleotides with defined spacing and showed a significant increase in inclusion in the hnRNP C knockdown cells are depicted. cDNA counts corresponding to positions in plus and minus strand transcripts are shown in blue and red, respectively. Gene names and genomic sequence around cross-link nucleotides (highlighted by blue or red boxes indicating plus-strand or minus-strand location) are given above each panel. A distance of 165 nucleotides is marked by a red arrow with shaded bars on either side representing ten nucleotide intervals. Clustered cross-link nucleotides are highlighted in grey. A mutual exclusive exon in MTRF1 pre-mRNA is indicated by an asterisk. Images are based on the UCSC genome browser (human genome, version hg18; C12orf23, chromosome 12, nucleotides 105,885,065 – 105,885,394; MTRF1, chromosome 13, nucleotides 40,734,402 – 40,734,731; PRKAA1, chromosome 5, nucleotides 40,810,631 – 40,810,960; TBL1XR1, chromosome 3, nucleotides 178,361,247 – 178,361,576; ZNF195, chromosome 11, nucleotides 3,347,071 – 3,347,400). (b) Quantification of splicing changes of the alternative exons depicted in (a). RNA from hnRNP C knockdown (kd) and control (c) HeLa cells was analyzed using RT-PCR and capillary electrophoresis. Capillary electrophoresis image and signal quantification are shown for each exon. Quantified transcripts including (in) or excluding (ex) the regulated alternative exon are marked on the right. Average quantification values of exon inclusion (white) and exclusion (grey) are given as a fraction of summed values. Error bars represent standard deviation of three replicates. Change in exon inclusion and p values are given in Supplementary Table 3. The asterisk indicates the PCR product for the RNA isoform of a mutually exclusive exon in MTRF1 pre-mRNA as depicted in (a). Its inclusion is strongly increased in hnRNP C knockdown cells consistent with our model that hnRNP C binding within the polypyrimidine tract leads to silencing of exons.
Figure 6
Figure 6
A model of hnRNP C tetramer binding at silenced and enhanced alternative exons. hnRNP C protein monomers are depicted in yellow with the RRM domains in grey. The schematic RNA molecule is shown to contact the RRM domains via uridine tracts and the bZLM domains via electrostatic interactions. Binding of the RRM domains on both sides of an alternative exon results in silencing of exon inclusion (blue), whereas tetramer binding to the preceding intron enhances exon inclusion (red).

References

    1. Nilsen TW, Graveley BR. Expansion of the eukaryotic proteome by alternative splicing. Nature. 463:457–463. - PMC - PubMed
    1. Wahl MC, Will CL, Lührmann R. The spliceosome: design principles of a dynamic RNP machine. Cell. 2009;136:701–718. - PubMed
    1. Chen M, Manley JL. Mechanisms of alternative splicing regulation: insights from molecular and genomics approaches. Nat Rev Mol Cell Biol. 2009;10:741–754. - PMC - PubMed
    1. Beyer AL, Christensen ME, Walker BW, LeStourgeon WM. Identification and characterization of the packaging proteins of core 40S hnRNP particles. Cell. 1977;11:127–138. - PubMed
    1. Steitz JA, Kamen R. Arrangement of 30S heterogeneous nuclear ribonucleoprotein on polyoma virus late nuclear transcripts. Mol Cell Biol. 1981;1:21–34. - PMC - PubMed

Publication types