. 2010 Jun 25;141(7):1171-82.
doi: 10.1016/j.cell.2010.05.026.

Mobile interspersed repeats are major structural variants in the human genome

Affiliations

Mobile interspersed repeats are major structural variants in the human genome

Cheng Ran Lisa Huang et al. Cell. .

Abstract

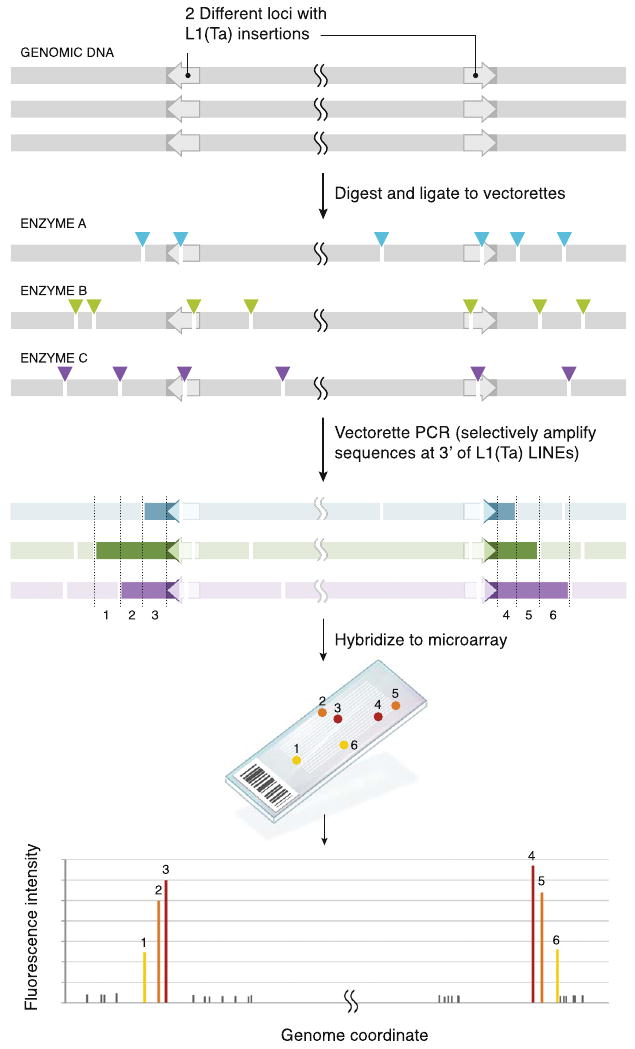
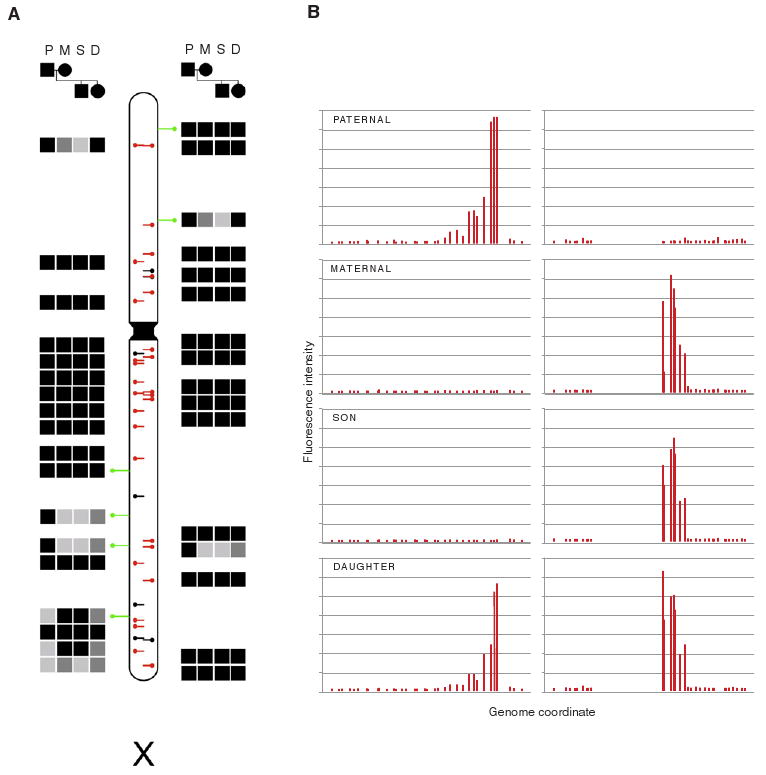
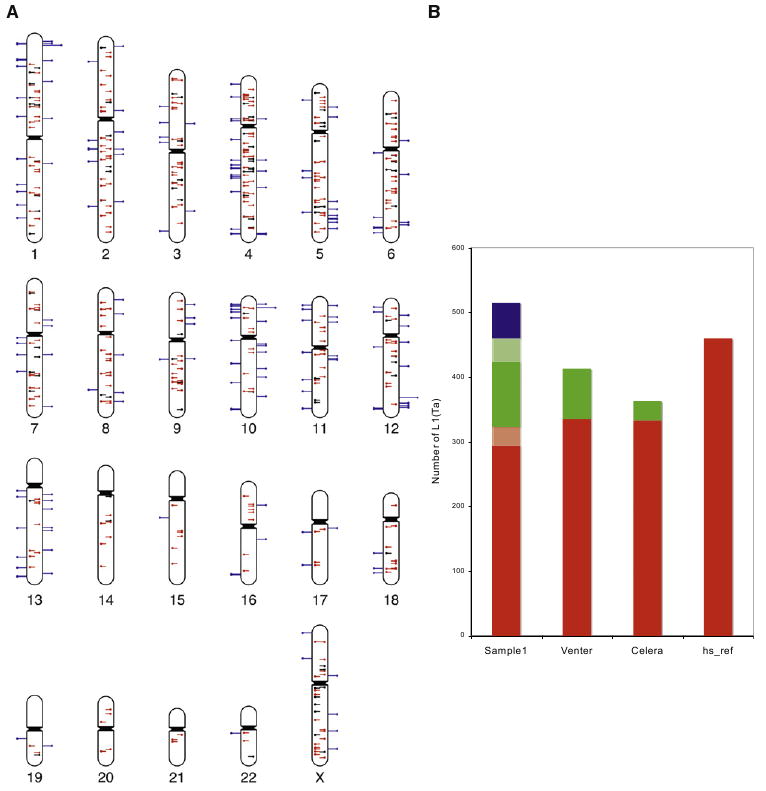
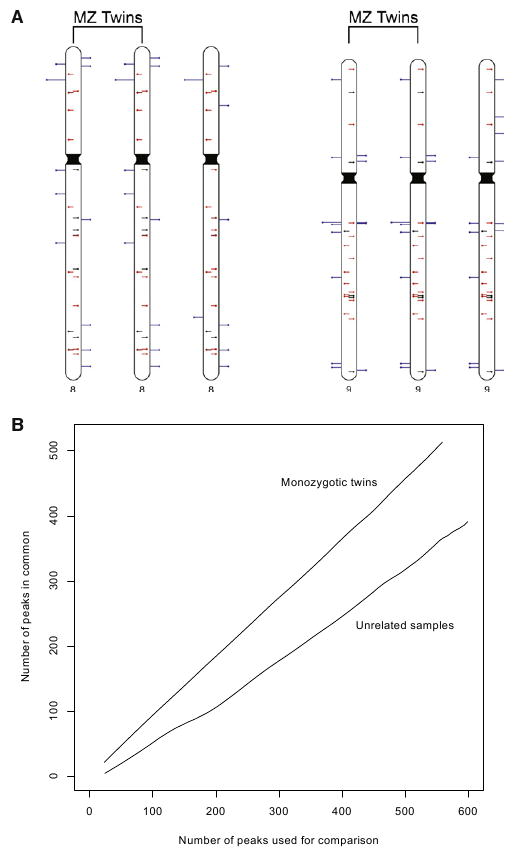
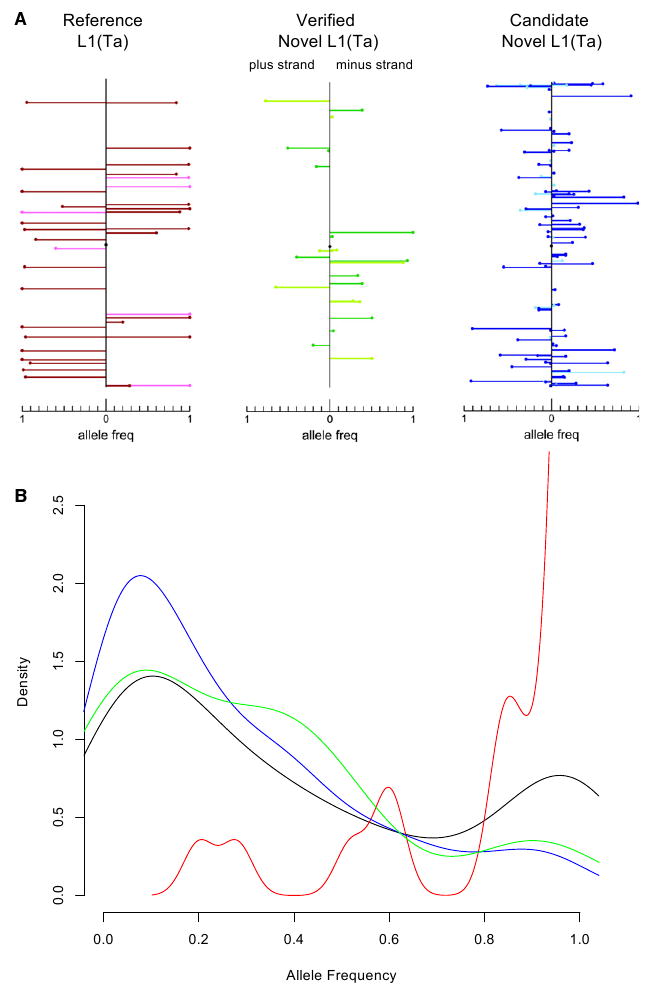
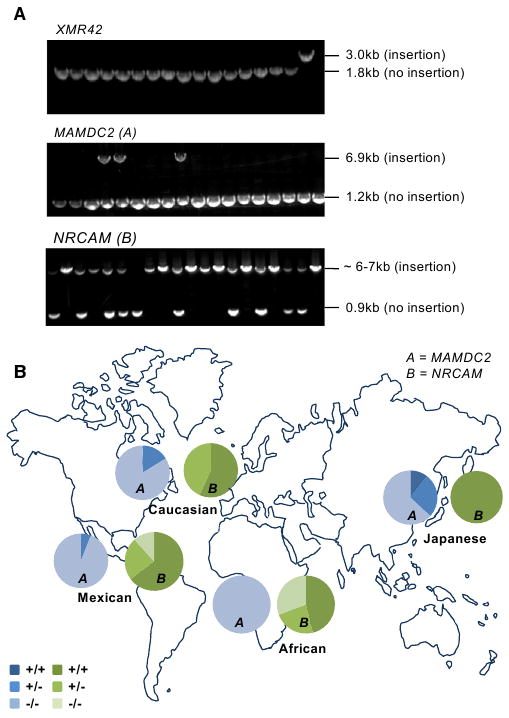
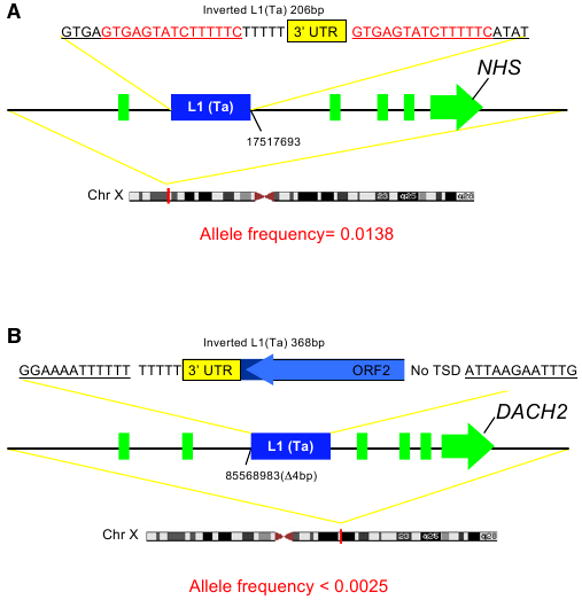
Characterizing structural variants in the human genome is of great importance, but a genome wide analysis to detect interspersed repeats has not been done. Thus, the degree to which mobile DNAs contribute to genetic diversity, heritable disease, and oncogenesis remains speculative. We perform transposon insertion profiling by microarray (TIP-chip) to map human L1(Ta) retrotransposons (LINE-1 s) genome-wide. This identified numerous novel human L1(Ta) insertional polymorphisms with highly variant allelic frequencies. We also explored TIP-chip's usefulness to identify candidate alleles associated with different phenotypes in clinical cohorts. Our data suggest that the occurrence of new insertions is twice as high as previously estimated, and that these repeats are under-recognized as sources of human genomic and phenotypic diversity. We have just begun to probe the universe of human L1(Ta) polymorphisms, and as TIP-chip is applied to other insertions such as Alu SINEs, it will expand the catalog of genomic variants even further.


Figures

Figure 1
Figure 1. Transposon Insertion Profiling Chip Method
Human genomic DNA contains numerous L1(Ta) insertions (arrows 5′ → 3′); minus (left) and plus strand (right) insertion are illustrated here. Multiple copies of genomic DNA are digested in parallel with different REs (colored arrows, sites; each color is a different RE), and vectorette linkers (data not shown) are ligated to fragments. Vectorette PCR then specifically amplifies 3′ L1(Ta) sequence and unique genomic sequence 3′ of the L1(Ta) insertions (resulting amplicons are denoted by colored fragments). The cuts create a series of variable-length PCR templates for each L1(Ta) insertion. Genomic DNA fragments lacking L1(Ta)insertions are not amplified. Amplicons are labeled and hybridized to genomic tiling microarrays, generating peaks of signal intensity at probes (1–6) corresponding to genomic locations immediately adjacent to L1(Ta) insertions. For each peak, probes closest to L1(Ta) have highest fluorescence intensity with a gradient of diminishing signal seen downstream of the insertion because proximal probes are represented in more PCR products and shorter PCR products including them amplify more efficiently. Thus, slope of the signal gradient (±) opposes insertion orientation. See also Figure S1.
Figure 2
Figure 2. Inheritance Pattern of X Chromosome L1s
(A) L1(Ta) insertion profiles were generated for a family by TIP-chip using X chromosome microarrays. Presence (filled squares) or absence (empty squares) of peaks is indicated in paternal (P), maternal (M), son (S), and daughter (D) samples. Black or gray filled squares indicate an L1(Ta) detected at a specific site, as opposed to no fill; gray indicates inferred heterozygosity. Lollipops on the ideogram correspond to insertion coordinates. Black lines in center mark L1(Ta) incorporated in hs_ref NCBI Build 36.1. These are overlaid with red where observed. Green lines are PCR-verified novel insertions. Side represents insertion orientation (left = plus strand). In this family, 6 L1(Ta)s are paternal, nonmaternal; 4 are maternal, nonpaternal; and 4 additional maternal L1(Ta)s were not passed to her son, indicating maternal heterozygosity. Thus at least 33.33% of insertions found are polymorphic in this family. (B) Raw intensity data of two representative reference L1(Ta) insertions (one in each orientation) across four family members. x axis indicates genomic coordinate. Probe fluorescence intensity is shown on y axis. Each bar represents one array probe.
Figure 3
Figure 3. Genome-wide Mapping of L1(Ta) Insertions in an Individual
(A) Ideogram illustrates TIP-chip peaks in an individual; 514 peaks are included after imposing the cutoff (Experimental Procedures). Marks show predicted positions of L1(Ta) insertions on the plus (left side) and minus strands. Central lines similarly illustrate position and orientation of L1(Ta)s in the human reference sequence (hs_ref NCBI Build 36.1). These are color coded to indicate those identified by TIP-chip in this individual (red, n = 323) and those not seen in this sample (black). Blue lines on the outside of the chromosome correspond to nonreference insertions (n = 191). In addition to reference L1(Ta)s, 52 were considered true positives because they correspond to insertions included in dbRIP (n = 25) or were described by human sequencing projects (n = 24), as well as 3 by Beck and Moran (Beck et al., 2010). As described further in the text, additional TIP-chip peaks were verified by PCR and sequencing. (B) TIP-chip and whole-genome sequencing in identifying L1(Ta) insertions. The y axis shows the L1(Ta) count in each sample. Sample1 was profiled by TIP-chip, whereas the other three samples are from different whole-genome sequencing approaches. Insertions present in hs_ref are displayed in red. Verified nonreference L1(Ta) insertions are shown in green. Lighter shades of red reflect reference insertions that were not retained after the imposed cutoff, while that of green reflects 3′ PCR verified insertions that might not become sequence verified. Candidate novel L1(Ta) insertions identified by TIP-chip after the cutoff and awaiting further verification, are marked in blue. The ability of TIP-chip to identify L1(Ta) insertions is comparable to whole-genome sequencing. See also Figure S2 and Table S1.
Figure 4
Figure 4. High Reproducibility of Whole-Genome TIP-chip
(A) Ideogram illustrating TIP-chip peaks on chromosomes 8 and 9 in a monozygotic twin pair and an unrelated individual. Marks on chromosomes show predicted positions of L1(Ta) insertions on the plus (left side) and minus strands. Central lines similarly illustrate position and orientation of L1(Ta)s in hs_ref. These are color-coded to indicate L1(Ta)s identified by TIP-chip in these individuals (red) and those not seen in this sample (black). Blue lines on the outside of the chromosome correspond to candidate nonreference L1(Ta)s. When our automated peak identification program is complemented by visual inspection of the raw data, twins have identical peak patterns while displaying many polymorphisms as compared to the unrelated individual (right most). (B) Correspondence at the top (CAT) (Irizarry et al., 2005) plot illustrating consistency in the data obtained from a monozygotic twin pair as compared to that of two unrelated individuals at the whole-genome level. The x axis shows the number of the peaks used for comparison, taken in rank order. The y axis indicates the number of peaks in common between the two samples. Twins share far more high-ranking peaks than unrelated individuals. See also Figure S3.
Figure 5
Figure 5. Polymorphism of X chromosome L1(Ta)s
(A) Each mark represents a L1(Ta) insertion. y axis denotes position along the X chromosome and the x axis reflects allele frequencies for L1(Ta) insertions on the plus (left) and minus strands (i.e., % of males with respective insertion). In total, 75 unrelated clinical male samples collected in the United States were included in this analysis; samples were not selected based on ethnic background. As a generalization, L1(Ta)s included in hs_ref (reference L1(Ta)s, red; leftmost panel) had higher allele frequencies (0.896 ± 0.202) than novel L1(Ta)s identified (0.263 ± 0.266, green and blue for PCR verified and not yet verified, respectively, see Table S2). No significant difference in allele frequencies were observed comparing intergenic L1(Ta)s (darker hue) with intronic/intragenic insertions (lighter hue). (B) Probability density function of allele frequencies of L1(Ta) insertions on the X chromosome. The area under each curve equals one. The x axis denotes the allele frequency ranging from 0 to 1 (present in all samples tested). Allele frequencies are calculated using X chromosome TIP-chip profiles of 75 unrelated males. The red curve shows the probability density function for insertions in hs_ref. The green curve depicts verified insertions. The blue curve displays TIP-chip peaks not yet verified. Black indicates the combined total of all three classes described above. See also Figure S4 and Table S2.
Figure 6
Figure 6. Polymorphism of L1(Ta)s
(A) Agarose gel images showing genotyping PCR products for three different L1(Ta) insertion sites in 17 individuals. In each case, primers were designed to flank the L1(Ta) insertion position identified by TIP-chip. Top panel shows a 1.2 kb insertion unique to the proband studied; about 600 other individuals were homozygous or hemizygous for the empty allele (i.e., lacking this X chromosome L1(Ta)). Middle gel shows an intronic L1(Ta) insertion in MAMDC2 on chromosome 7. Three genotypes were observed: (1) homozygous present (one band at 6.9 kb); (2) heterozygous (two bands, 6.9 kb and 1.2 kb); (3) homozygous absent (a single band at 0.9 kb). The third insertion site shown is within NRCAM on chromosome 9 (∼6–7 kb amplicon represents insertion allele, 0.9 kb represents empty allele). (B) Pie charts indicate genotype distribution for two representative nonreference L1(Ta)s (not included in hs_ref) identified by TIP-chip studies of an individual (see Figure 3) across two human ethnic diversity panels. The total sample size of both diversity panels is 198 people. The Caucasian, Mexican and Japanese sample groups were represented most highly (n = 37, 17 and 18 respectively) and were used for Hardy-Weinberg calculations. For Locus A (MAMDC2) the allele frequencies for each population, as well as the chi square values for the biggest population groups are as follows: Caucasians (0.08; χ2 = 0.29); Mexican (0.03; χ2 = 0.02); Japanese (0.25; χ2 = 1.41); African (0.00, n = 13). For Locus B (NRCAM) the allele frequencies for each population, as well as the chi-square values for the biggest population groups are as follows: Caucasians (0.79; χ2 = 2.82); Mexican (0.77; χ2 = 2.04); Japanese (1.00); African (0.58, n = 13). See also Figure S5 and Table S3.
Figure 7
Figure 7. L1(Ta) Insertions Found in Clinical Genetics Patients
(A) NHS locus insertion. In this case, a 206bp L1(Ta) inserted into the first intron of the NHS gene. (B) DACH2 locus insertion. A 368bp 5′ truncated L1(Ta) is inserted into the second intron of DACH2, deleting 4bp of the flanking sequence. This insertion was unique to the proband studied and not seen in 400 other samples. See also Figure S6 and Table S4.

Comment in

References

    1. Arnold C, Hodgson IJ. Vectorette PCR: A novel approach to genomic walking. PCR Methods Appl. 1991;1:39–42. - PubMed
    1. Bailey JA, Carrel L, Chakravarti A, Eichler EE. Molecular evidence for a relationship between LINE-1 elements and X chromosome inactivation: the Lyon repeat hypothesis. Proc Natl Acad Sci USA. 2000;97:6634–6639. - PMC - PubMed
    1. Beck CR, Collier P, Macfarlane C, Malig M, Kidd JM, Eichler EE, Badge RM, Moran JV. LINE-1 retrotransposition activity in human genomes. Cell. 2010;141:1159–1170. this issue. - PMC - PubMed
    1. Belancio VP, Roy-Engel AM, Deininger P. The impact of multiple splice sites in human L1 elements. Gene. 2008;411:38–45. - PMC - PubMed
    1. Bennett EA, Coleman LE, Tsui C, Pittard WS, Devine SE. Natural genetic variation caused by transposable elements in humans. Genetics. 2004;168:933–951. - PMC - PubMed

Publication types

Substances