. 2010 Jun 25;141(7):1220-9.
doi: 10.1016/j.cell.2010.05.006.

A large-scale conformational change couples membrane recruitment to cargo binding in the AP2 clathrin adaptor complex

Affiliations

A large-scale conformational change couples membrane recruitment to cargo binding in the AP2 clathrin adaptor complex

Lauren P Jackson et al. Cell. .

Abstract

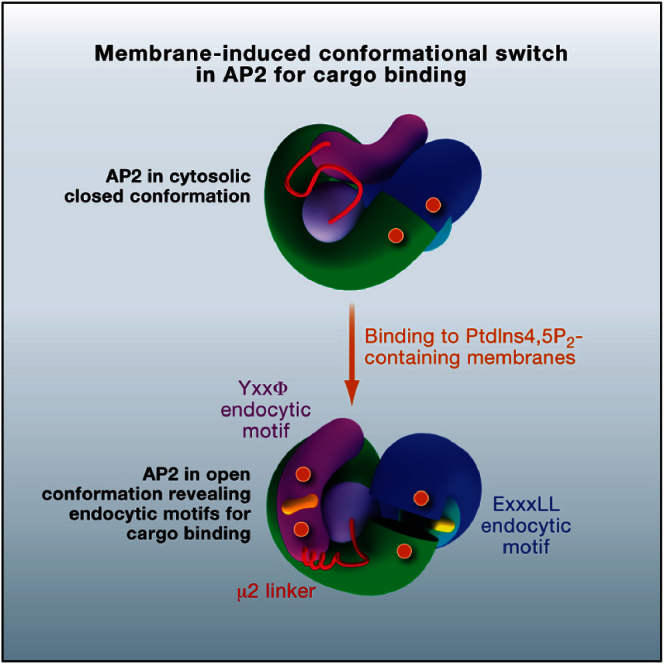
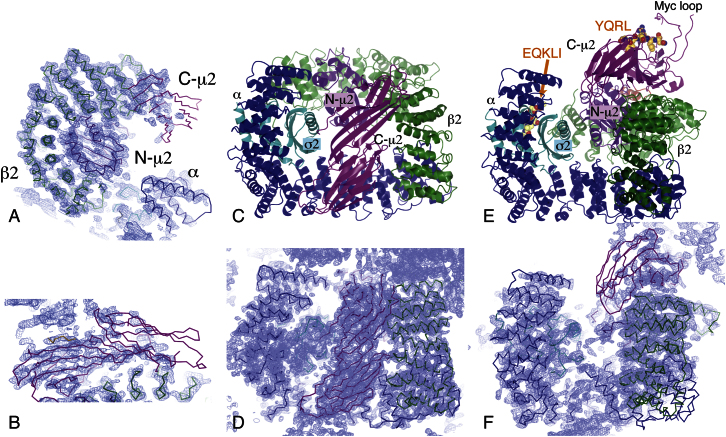
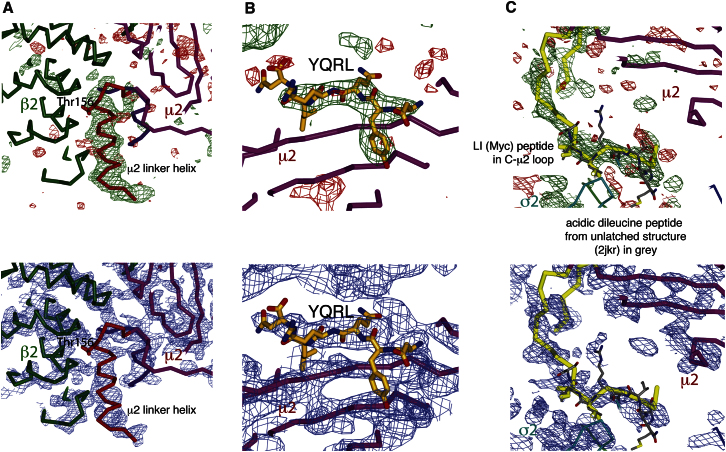
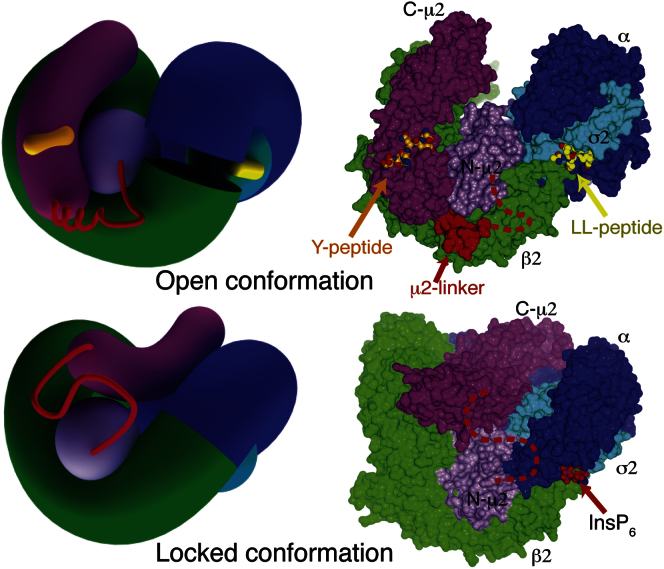
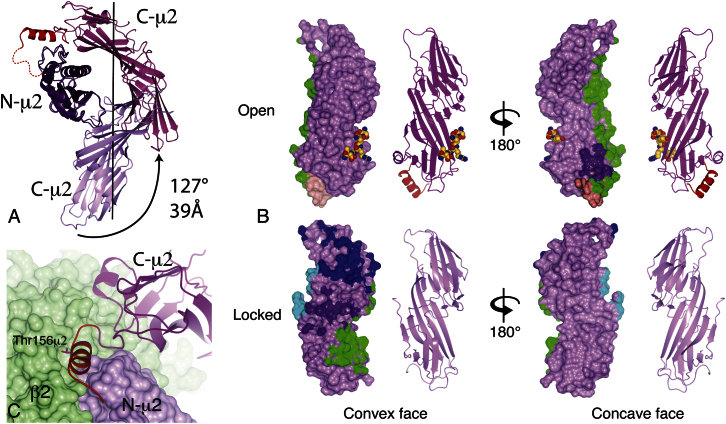
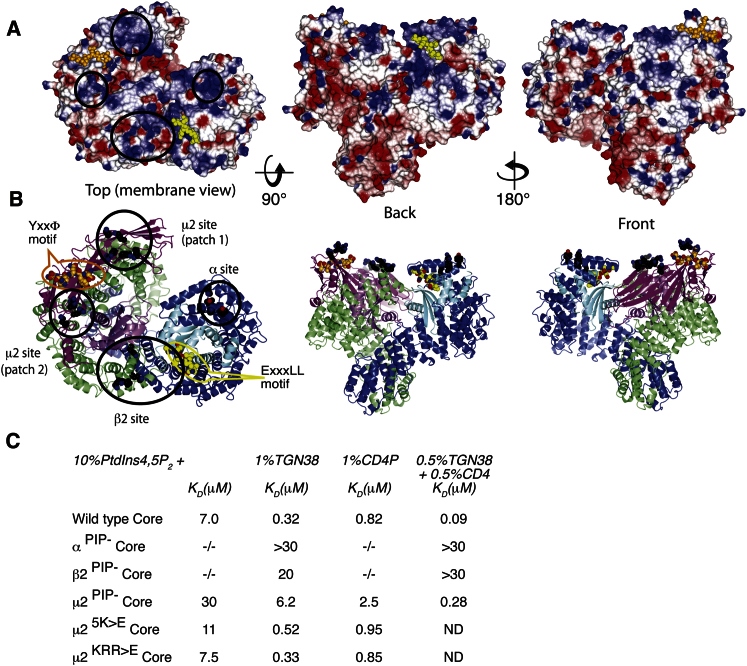
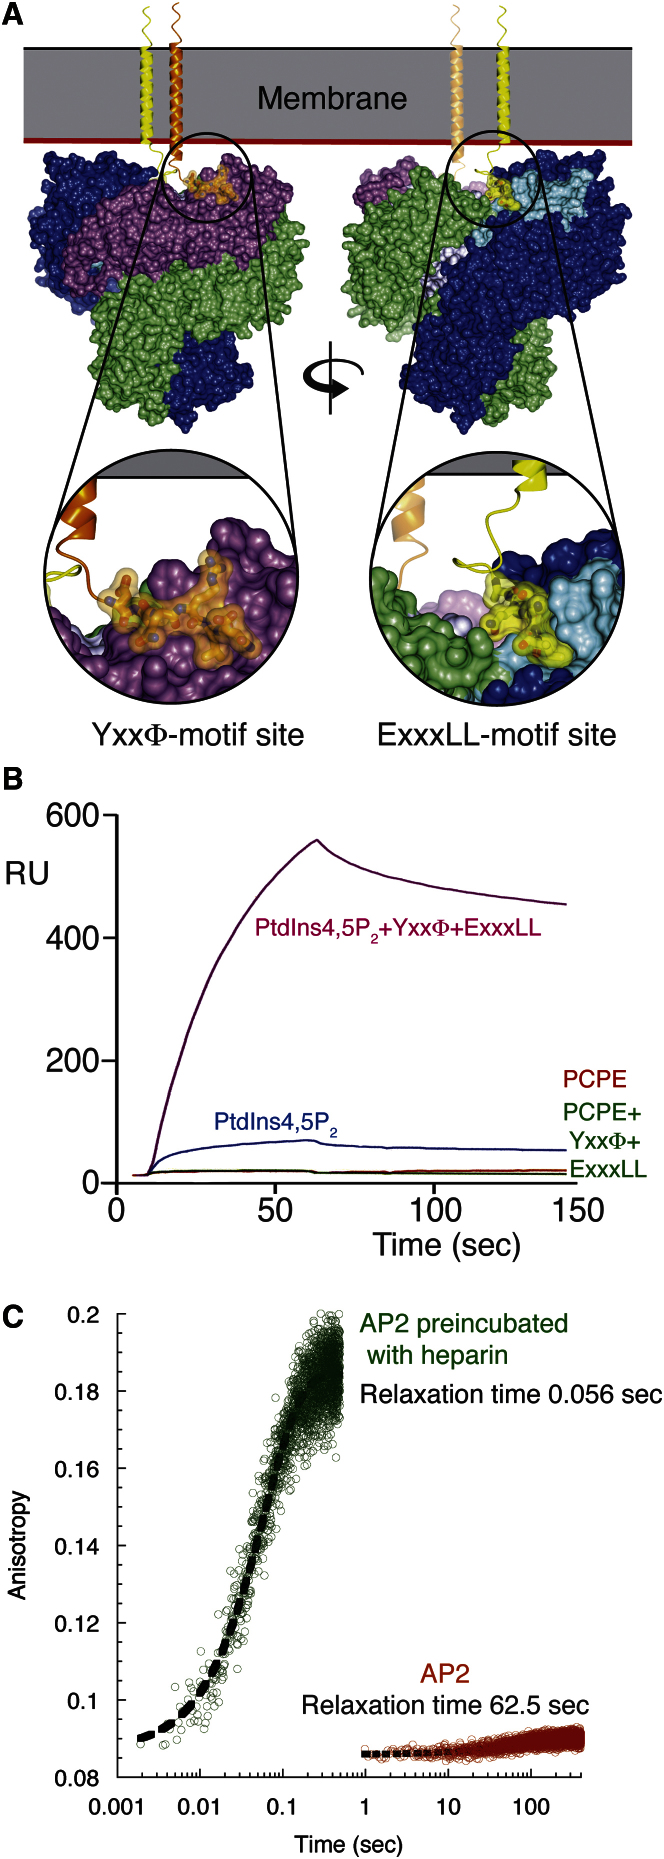
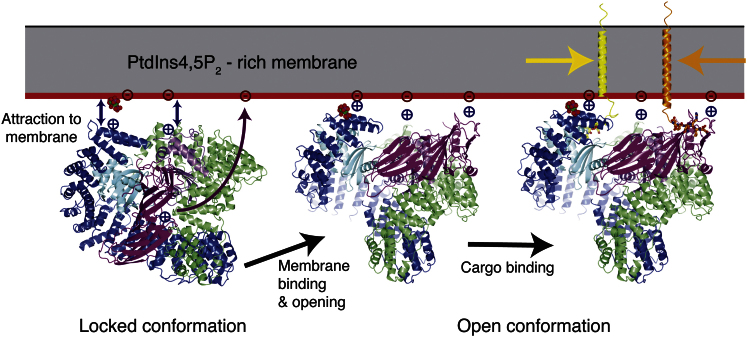
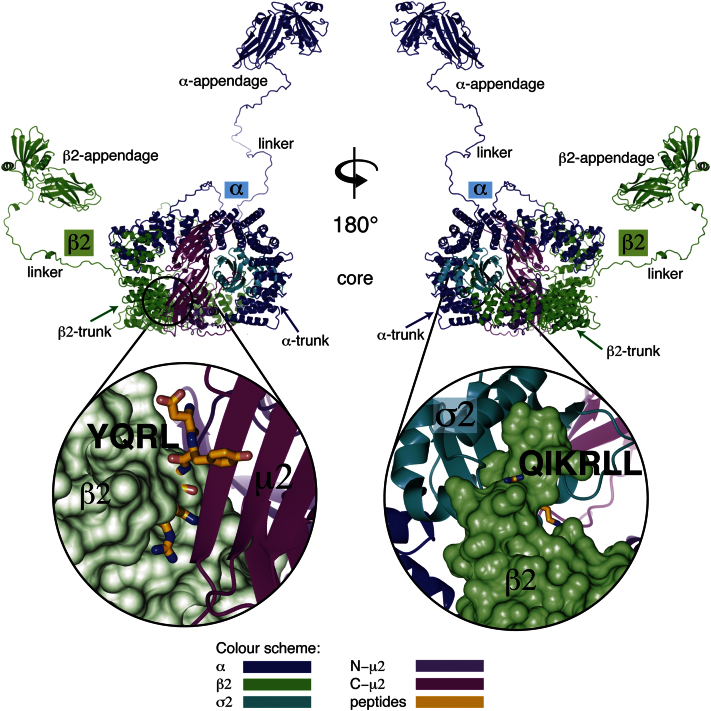
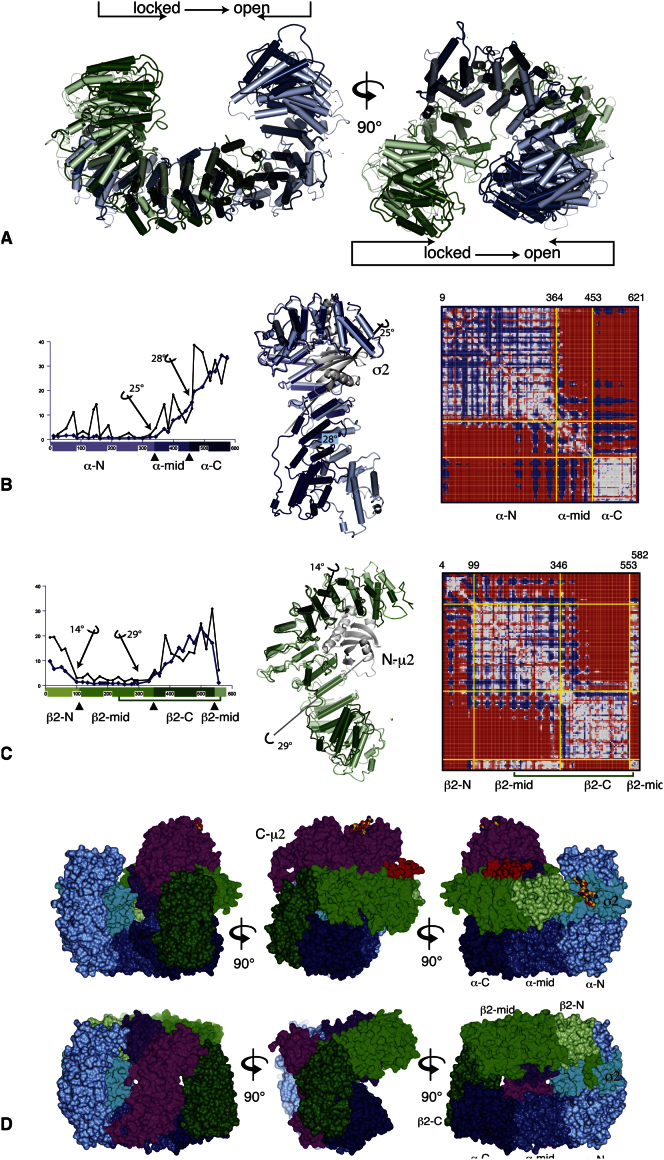
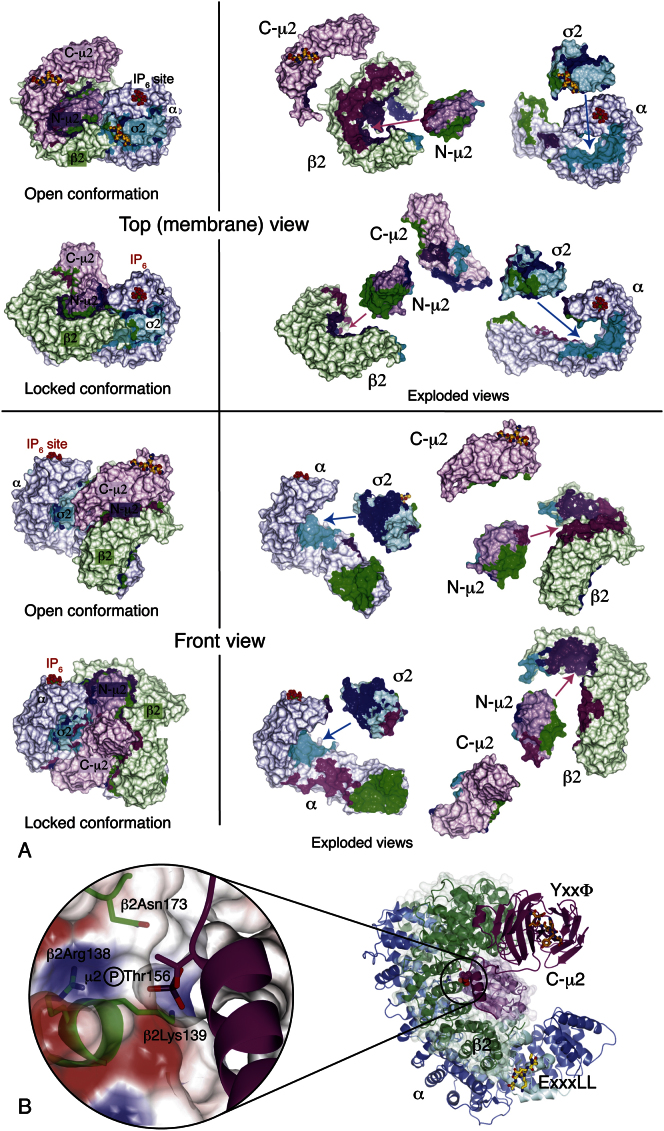
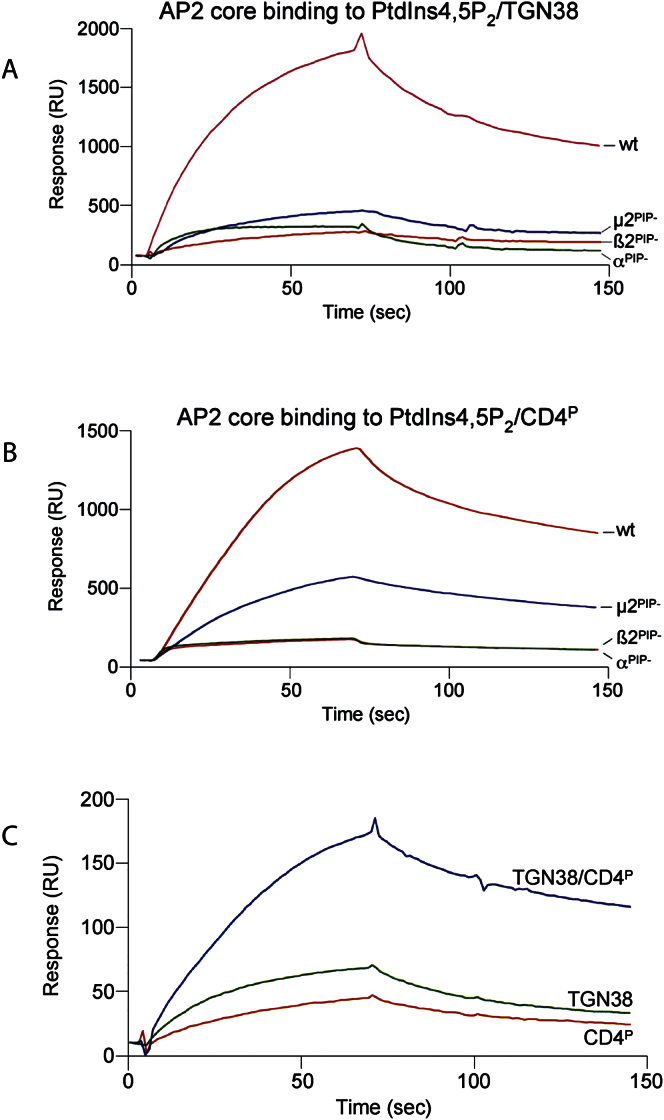
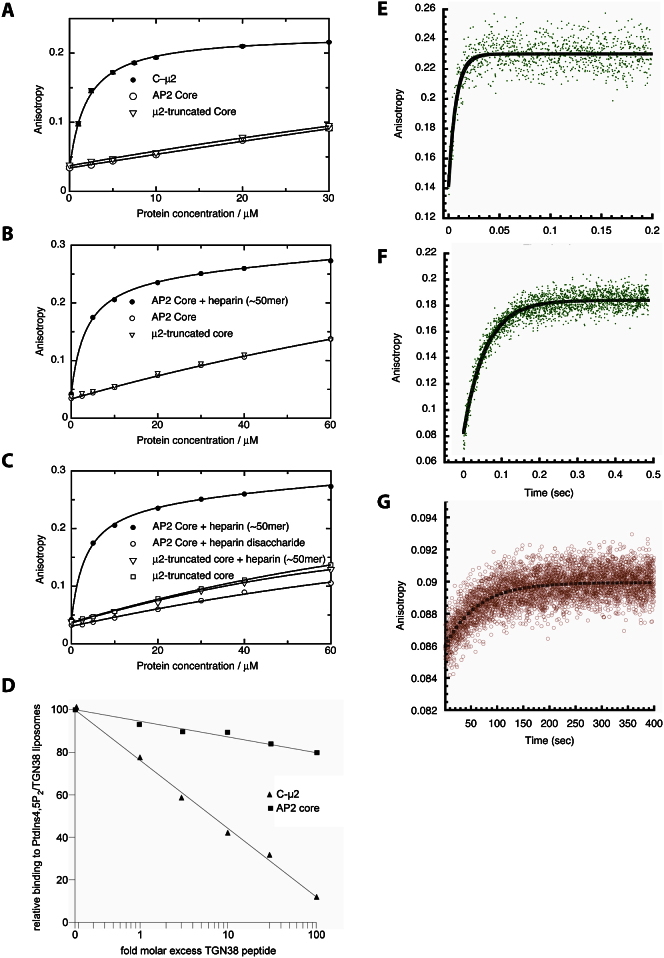
The AP2 adaptor complex (alpha, beta2, sigma2, and mu2 subunits) crosslinks the endocytic clathrin scaffold to PtdIns4,5P(2)-containing membranes and transmembrane protein cargo. In the "locked" cytosolic form, AP2's binding sites for the two endocytic motifs, YxxPhi on the C-terminal domain of mu2 (C-mu2) and [ED]xxxL[LI] on sigma2, are blocked by parts of beta2. Using protein crystallography, we show that AP2 undergoes a large conformational change in which C-mu2 relocates to an orthogonal face of the complex, simultaneously unblocking both cargo-binding sites; the previously unstructured mu2 linker becomes helical and binds back onto the complex. This structural rearrangement results in AP2's four PtdIns4,5P(2)- and two endocytic motif-binding sites becoming coplanar, facilitating their simultaneous interaction with PtdIns4,5P(2)/cargo-containing membranes. Using a range of biophysical techniques, we show that the endocytic cargo binding of AP2 is driven by its interaction with PtdIns4,5P(2)-containing membranes.


Figures

None
Graphical abstract
Figure 1
Figure 1
Structure of the Open Conformation of the AP2 Core (A) Part of the experimentally phased, solvent-flattened electron density map with the refined model superimposed. (B) The experimental electron density map in the region of the C-terminal domain of μ2, showing good density for the first subdomain (left) but very weak density for the poorly ordered second subdomain (right). (C) An overall view of the whole AP2 core in the locked conformation. The bowl is formed by the helical solenoids of the α (blue) and β2 (green) subunits, together with σ2 (cyan) and the N-terminal domain of μ2 (purple). The C-terminal domain of μ2 (C-μ2) (magenta) is in the center of the bowl. This coloring scheme is used in all subsequent figures. (D) Experimental electron density for the locked form (Collins et al., 2002), in the same view as (C), showing the C-μ2 in the center of the bowl. (E) An overall view of the whole AP2 core in the open conformation. C-μ2 is no longer in the bowl, but on the outside of β2, and carries the YxxΦ motif peptide (gold). The myc loop within C-μ2 that reaches into the acidic dileucine motif-binding site on a neighboring molecule in the crystal is labeled, and the site itself is indicated (LI (Myc) peptide). In subsequent pictures this myc loop is omitted for clarity, but the EQKLI sequence is shown in its position on σ2. (F) Experimental electron density for the new open form, in the same view as (C), showing no density for C-μ2 in the bowl but density in its new position on the outside of the β2 subunit.
Figure 2
Figure 2
New Structural Features Not Found in the “Locked” Structure The top panels are “omit” maps, mFo-DFc difference maps calculated by omitting part of the structure, randomly displacing all the atoms a little and then refining, using the experimental phases as restraints. Omitted residues are colored red (linker) or yellow (YxxΦ peptide and dileucine peptide mimic). The lower panels show the solvent-flattened experimental map. (A) The μ2 linker folds into a helix lying in a groove between N-μ2 and β2: the side chain of Thr156, which can be phosphorylated, is shown. (B) The YxxΦ motif peptide is bound to the C-μ2 domain, in the equivalent position to that found on the isolated C-μ2 domain (Owen and Evans, 1998). (C) Electron density in the acidic dileucine peptide-binding site on σ2 is linked to C-μ2 across a crystal contact and has been interpreted as part of the myc-tag EQKLI. The peptide QIKRLL from the unlatched structure (gray) is shown in its position relative to σ2.
Figure 3
Figure 3
The Conformational Change in AP2 on Cargo Binding Schematic (left) and surface (right) representations of the open (upper) and locked (lower) conformations. In the transition from the locked to the open structure, the puckered ring formed from α and β2 narrows and splits between the N termini, and C-μ2 emerges from its bowl and rotates roughly about its long axis. σ2 and N-μ2 remain fixed to α and β2, respectively.
Figure 4
Figure 4
Changes in the Positioning and Interactions of C-μ2 (A) In the transition from the locked (pale mauve ribbons) to the open structure (dark mauve), C-μ2 rotates relative to N-μ2 by 127° around an axis (black line) roughly along its long axis with a translation of 39 Å along the axis. The linker helix is shown red. (B) C-μ2 makes completely different contacts with other subunits in the two structures. Two reversed views of the C-μ2 surfaces are shown, colored mauve (with the linker helix pink), and by their contacts with the other subunits: α blue, β2 green, σ2 cyan, and N-μ2 purple. The YxxΦ motif peptide is shown on the open structure. (C) The μ2 linker helix lies in a shallow groove between β2 and N-μ2, with the μ2Thr156 residue that can be phosphorylated partly buried.
Figure 5
Figure 5
The Membrane Interaction Surface of AP2 (A) Three views of the surface colored by electrostatic potential (contoured from −0.5 V [red] to +0.5 V [blue]). Left: top view of positively charged membrane-binding face. Center and right: back and front side views. The two peptides are shown in gold (Y-peptide) and yellow (LL-peptide) and the mutated basic patches are indicated by black circles. (B) Equivalent ribbon representations, with mutated patches of Lys and Arg residues on α, β2, and C-μ2 that affect membrane binding shown in black. (C) Equilibrium binding constants for the binding of wild-type and PtdIns4,5P2-binding site mutants of AP2 cores to liposomes displaying the YxxΦ motif of TGN38 or the dileucine sorting signal of CD4, or both signals, displayed in PtdIns4,5P2-containing liposomes as determined by SPR. Values were calculated from rate constants obtained using five different concentrations of AP2 ranging from 50 nM to 1 μM. Sample sensorgrams, corrected for nonspecific binding to PC/PE liposomes and obtained using concentrations of AP2 ranging from 100 nM to 20 μM are shown in Figure S4.
Figure 6
Figure 6
Interaction of AP2 Cores with YxxΦ and Acidic Dileucine Motifs (A) The two motif-binding sites for YxxΦ (gold) and acidic dileucine (yellow) are both freely accessible when AP2 is in the open conformation on the membrane. The peptides are shown attached to a modeled transmembrane helix. (B) SPR sensorgrams of binding of AP2 core to liposomes with various compositions as indicated showing that there is no detectable binding to liposomes containing both YxxΦ and [ED]xxxL[LI] motif peptides if PtdIns4,5P2 is not present. (C) AP2 (30 μM orange) or AP2 preincubated with heparin (15 μM green) were rapidly mixed with fluorescein-labeled YxxΦ peptide in a stopped-flow spectrometer and the change in anisotropy upon binding was measured. The anisotropy change was fitted to a single exponential function to obtain relaxation times.
Figure 7
Figure 7
Membrane-Induced Conformational Switching of AP2 for Cargo Binding AP2 in the locked conformation (left) is attracted to the PtdIns4,5P2 headgroups in the membrane through the α and β2 subunits. The conformational change to the open form (center) is triggered by the electrostatic attraction of C-μ2 to the membrane, which can then bind membrane-embedded cargo motifs (right). An animation is presented in Movie S3.
Figure S1
Figure S1
The Cargo Motif-Binding Sites of AP2 Are Blocked in the Locked Structure, Related to Figure 1 Top: overall composite view of the whole AP2 complex in its locked conformation. The “core” consists of the smaller σ2 and μ2 subunits, along with the N-terminal “trunk” domains of the long α and β2 subunits (Collins et al., 2002). These are linked to the folded appendage domains (Owen et al., 1999; Owen et al., 2000) by unstructured linker regions. Bottom: close-up of the two blocked sites for cargo motifs. Left: the YxxΦ site (gold peptide YQRL) on C−μ2 (magenta) is blocked by β2 (green surface). Right: the acidic dileucine site (yellow peptide QIKRLL) on σ2 (cyan) is blocked by the N-terminus of β2, with β2Tyr6 and β2Phe7 in the place of LL. All molecular figures throughout were made with CCP4MG (Potterton et al., 2004).
Figure S2
Figure S2
Conformational Changes in the α and β2 Subunits, Related to Figure 3 (A) In going from the locked conformation (pale colours, α blue, β2 green) to the open conformation (dark colors), the α/β2 solenoid bowl collapses inwards into the space vacated by C-μ2, as shown by the arrows. See also Movie S1 and Movie S2. (B) Analysis of the conformational change in the α subunit. The open and locked structures were superimposed on the σ2 subunit (white). The graph shows the shift (blue line) and relative rotation angle (black line) of each helix along the sequence. The conformational change can be approximated as hinge rotations of 25° and 28° between three rigid bodies (α-N, α-mid and α-C, light to dark blue, hinge points at residues 342 and 460 marked with triangles). In the centre, the open conformation is in dark blue, and the locked conformation in light blue, with the hinge axes indicated. The right-hand panel is a difference distance plot (Schneider, 2002) coloured from red (negative differences) through white (small differences) to blue (positive differences), showing the division into three mainly rigid groups. (C) Analysis of the conformational change in the β2 subunit. As in (A), except the structures were superimposed on the N-μ2 domain (white). The β2 subunit falls roughly into three rigid groups with hinge points shown at residues 98 and 346, coloured light to dark green, β2-N, β2-mid and β2-C. The C-terminal region folds back to join the middle region from residue 553, and the extreme N-terminus (residues 4-12) has an unrelated conformation. Centre and right panels, ribbon drawing and difference distance plot, as in (B). (D) Rigid groups in the conformational change. Three orthogonal views (left to right) of the open (top) and locked (bottom) conformations, coloured by the rigid groups. The rigid groups in α and β2 are coloured light to dark blue and green respectively. The C-terminal regions of the α and β2 solenoids (α-C and β2-C) form a single rigid group. Other colours: σ2 cyan; N-μ2 purple; C- μ2 magenta; μ2 linker (142-160), red.
Figure S3
Figure S3
Subunit Contacts in the AP2 Core, Related to Figure 4 (A) Two views of the open and locked conformations are shown, as a whole and in “exploded” views. The interacting surface patches of each subunit are coloured according to the subunit that they contact: α, blue; β2 green; σ2 cyan; Nμ-2 purple; C-μ2 magenta. Interacting surfaces were calculated and analysed in CCP4MG (Potterton et al 2004). (B) Left: a model of a phosphoryl group attached to the side chain identified as μ2Thr156, showing that it can fit in a positively charged pocket created by β2Arg138 and β2Lys139. β2Asn173 seems to form a hydrogen bond to μ2Thr156 in the structure. No attempt was made to model possible rearrangements around the site, apart from the threonine side chain. Right: structure of the whole AP2 core identifying the position of the μ2 linker and its potential phosphorylation site, which is shown enlarged on the left.
Figure S4
Figure S4
Binding of AP2 Core to Liposomes of Various Phospholipid and Cargo Peptide Composition, Related to Figure 5 (A and B) Wild type AP2 Core and mutants affecting the PtdIns4,5P2 binding sites in α, β2 and μ2 (all at 200 nM) were passed over sensor surfaces with the YxxΦ sorting motif from TGN38 (A) and the dileucine sorting signal of CD4 (B), both embedded in PtdIns4,5P2-containing liposomes. The displayed sensorgrams are corrected for non-specific binding to PC/PE liposomes. The rate constants for all interactions are given in the Table in Figure 5C and were calculated from experiments in which AP2 core binding was recorded for five different concentrations ranging from 100 nM to 20 μM. (C) Binding of AP2 to PtdIns4,5P2 liposomes containing either or both YxxΦ and acidic dileucine sorting motifs. The four flow cells of a L1 sensor surface were derivatized with liposomes containing 10% PtdIns4,5P2 (flow cell 1), 10% PtdIns4,5P2 + 1% YxxΦ signal (flow cell 2), 10% PtdIns4,5P2 + 1% dileucine signal (flow cell 3) or 10% PtdIns4,5P2 + 0.5% of each signal (flow cell 4). After a pulse injection with NaOH to stabilize the surface, the binding of the AP2 core was recorded as above. The sensorgram shows binding of 200 nM AP2 core to the indicated liposomes after subtraction of the binding level obtained for PtdIns4,5P2 liposomes.
Figure S5
Figure S5
Related to Figure 6 (A–C) Fluorescence anisotropy equilibrium binding curves. Fluorescence anisotropy was measured for varying pseudo-first order concentrations of protein (as indicated) mixed with fluorescent YxxΦ peptide as described in Experimental Procedures. (A) Comparison of C-μ2 with AP2; (B) comparison of AP2 with and without the addition of heparin; and (C) the effect of heparin chain length. Means of three or more measurements are plotted. Standard error is omitted for clarity but typically was in the range 0.001-0.004. (D) Competition of Core binding to YxxΦ/PtdIns4,5P2 liposomes by free YxxΦ peptide. 200 nM of either AP2 core or C-μ2 were incubated with the indicated concentrations of the TGN38 YxxΦ-containing peptide for 15 min at room temperature. Subsequently, protein with peptide was passed over PtdIns4,5P2/TGN38-containing liposomes. Binding was recorded for 2 min. The maximum binding levels for protein without addition of peptide were set to 100%. (E–G) Relaxation rates for Yxxφ-peptide interaction with C-μ2 and AP2 in the presence or absence of heparin. Protein and peptide were rapidly mixed in a stopped-flow spectrometer and the change in anisotropy that occurs upon binding was measured. The anisotropy change was fit to a single exponential to obtain relaxation times. Yxxφ binds to 15μM C-μ2 with a relaxation time (t) = 0.0073 s (E), to 15μM AP2 in the presence of heparin with t = 0.059 s (F) and to 30μM AP2 in the absence of heparin with t = 62.5 s (G).
None
None
None

References

    1. Austin C., Hinners I., Tooze S.A. Direct and GTP-dependent interaction of ADP-ribosylation factor 1 with clathrin adaptor protein AP-1 on immature secretory granules. J. Biol. Chem. 2000;275:21862–21869. - PubMed
    1. Baust T., Czupalla C., Krause E., Bourel-Bonnet L., Hoflack B. Proteomic analysis of adaptor protein 1A coats selectively assembled on liposomes. Proc. Natl. Acad. Sci. USA. 2006;103:3159–3164. - PMC - PubMed
    1. Boehm M., Aguilar R.C., Bonifacino J.S. Functional and physical interactions of the adaptor protein complex AP-4 with ADP-ribosylation factors (ARFs) EMBO J. 2001;20:6265–6276. - PMC - PubMed
    1. Bonifacino J.S., Traub L.M. Signals for sorting of transmembrane proteins to endosomes and lysosomes. Annu. Rev. Biochem. 2003;72:395–447. - PubMed
    1. Chaudhuri R., Mattera R., Lindwasser O.W., Robinson M.S., Bonifacino J.S. A basic patch on alpha-adaptin is required for binding of human immunodeficiency virus type 1 Nef and cooperative assembly of a CD4-Nef-AP-2 complex. J. Virol. 2009;83:2518–2530. - PMC - PubMed

Supplemental References

    1. Abrahams, J.P. (1997). Bias reduction in phase refinement by modified interference functions: introducing the γ function. Acta Crystallogr. D Biol. Crystallogr. 53, 371–376. - PubMed
    1. Adams, P.D., Grosse-Kunstleve, R.W., Hung, L.W., Ioerger, T.R., McCoy, A.J., Moriarty, N.W., Read, R.J., Sacchettini, J.C., Sauter, N.K., and Terwilliger, T.C. (2002). PHENIX: building new software for automated crystallographic structure determination. Acta Crystallogr. D Biol. Crystallogr. 58, 1948–1954. - PubMed
    1. Bricogne, G., Vonrhein, C., Flensburg, C., Schiltz, M., and Paciorek, W. (2003). Generation, representation and flow of phase information in structure determination: recent developments in and around SHARP 2.0. Acta Crystallogr. D Biol. Crystallogr. 59, 2023–2030. - PubMed
    1. Collins, B.M., McCoy, A.J., Kent, H.M., Evans, P.R., and Owen, D.J. (2002). Molecular architecture and functional model of the endocytic AP2 complex. Cell 109, 523–535. - PubMed
    1. Emsley, P., and Cowtan, K. (2004). Coot: Model-building tools for molecular graphics. Acta Crystallogr. D Biol. Crystallogr. 60, 2126–2132. - PubMed

Publication types