. 2010 Jul 9;142(1):52-64.
doi: 10.1016/j.cell.2010.05.029.

Environmental and genetic activation of a brain-adipocyte BDNF/leptin axis causes cancer remission and inhibition

Affiliations

Environmental and genetic activation of a brain-adipocyte BDNF/leptin axis causes cancer remission and inhibition

Lei Cao et al. Cell. .

Abstract

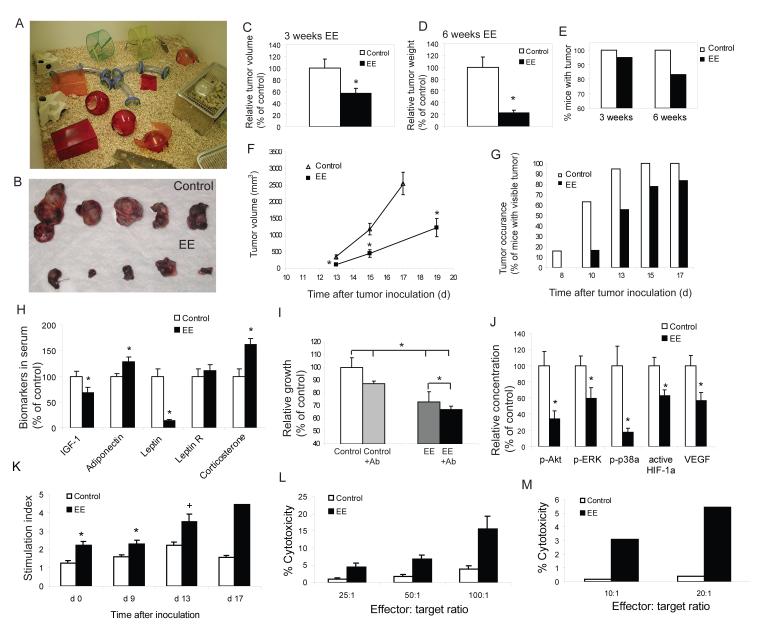
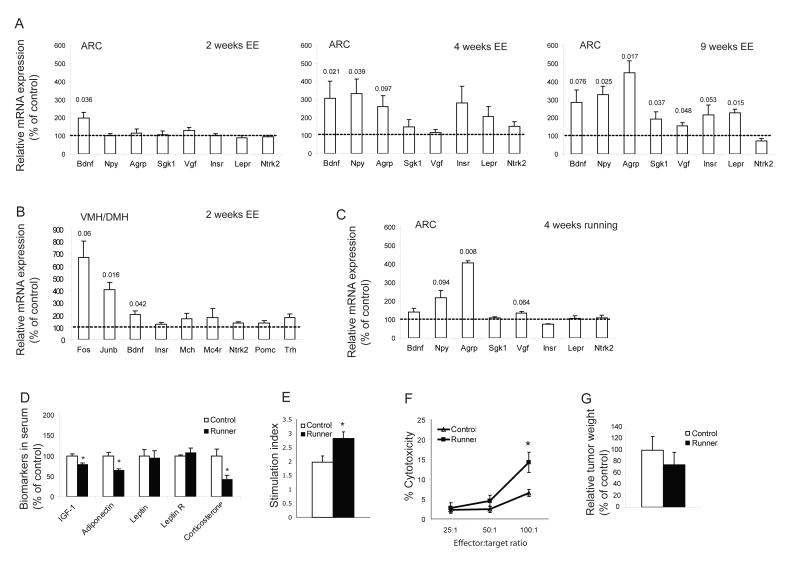
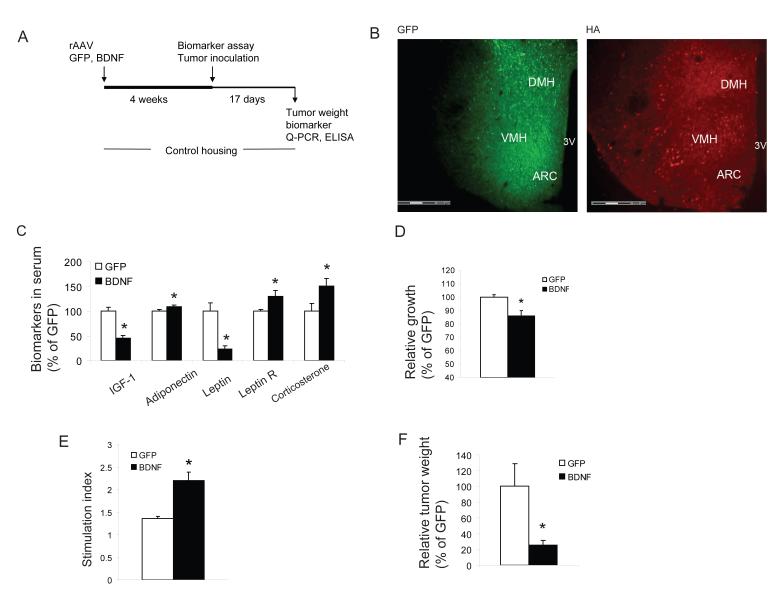
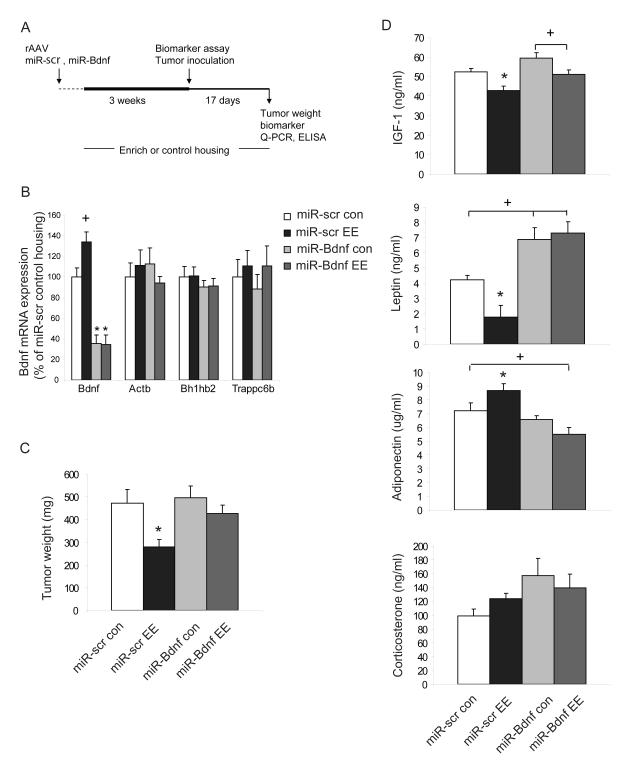
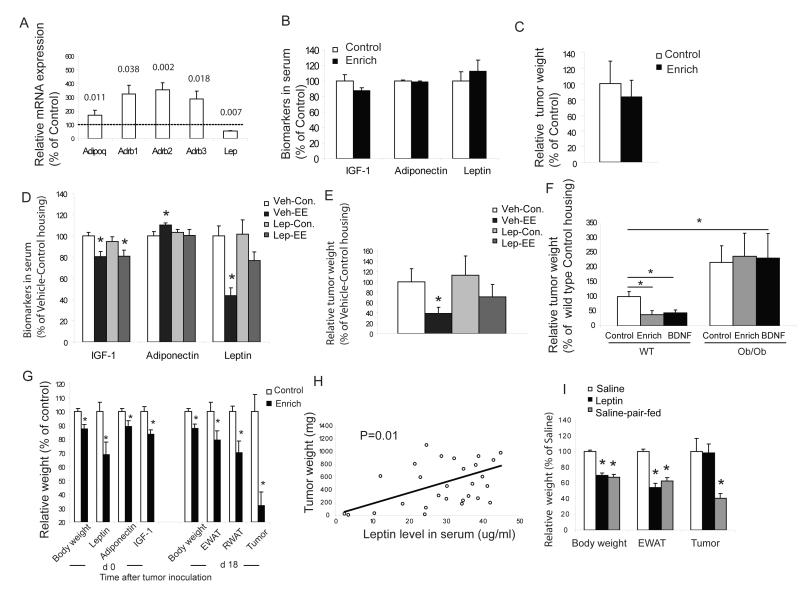
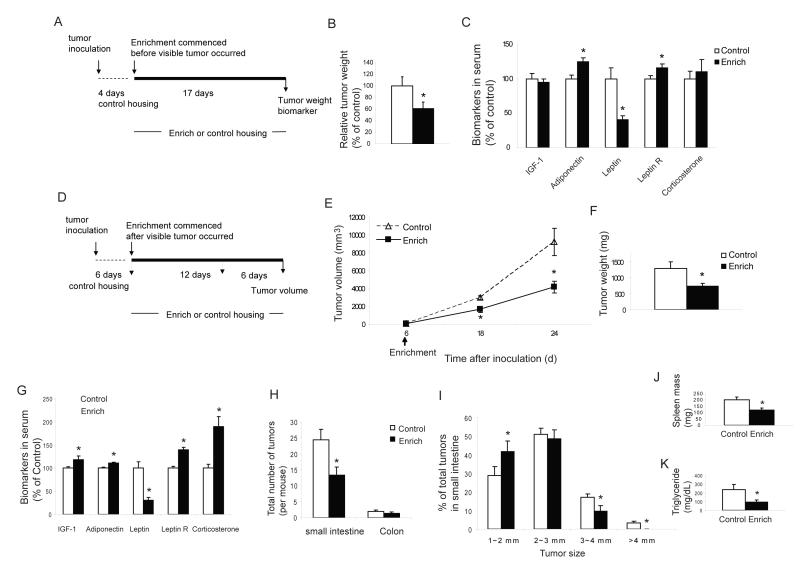
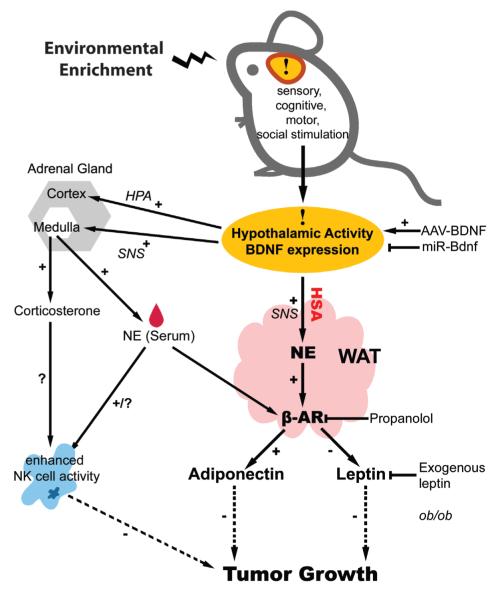
Cancer is influenced by its microenvironment, yet broader, environmental effects also play a role but remain poorly defined. We report here that mice living in an enriched housing environment show reduced tumor growth and increased remission. We found this effect in melanoma and colon cancer models, and that it was not caused by physical activity alone. Serum from animals held in an enriched environment (EE) inhibited cancer proliferation in vitro and was markedly lower in leptin. Hypothalamic brain-derived neurotrophic factor (BDNF) was selectively upregulated by EE, and its genetic overexpression reduced tumor burden, whereas BDNF knockdown blocked the effect of EE. Mechanistically, we show that hypothalamic BDNF downregulated leptin production in adipocytes via sympathoneural beta-adrenergic signaling. These results suggest that genetic or environmental activation of this BDNF/leptin axis may have therapeutic significance for cancer.


Figures

Figure 1
Figure 1. Enriched environment reduces tumor growth and affects biomarkers in serum, B16 melanoma cell proliferation in vitro, signaling pathways in the tumors and immune functions
(A) EE cage. (B) Representative B16 melanoma dissected d 17 after inoculation of 105 cells per mouse. Mice were housed in the EE or control cages for 6 w prior to tumor inoculation. (C) Three weeks of EE decreased tumor volume d 19 after inoculation (n=20 in each group, * P<0.05). (D) Six weeks of EE further reduced tumor weight d 17 after inoculation (n=18 in each group, * P<0.05). (E) EE induced complete tumor resistance in a subset of mice. All control mice showed visible tumors. (F) Four weeks of EE decreased tumor growth rate (n=20 in each group, * P<0.05). (G) Four weeks of EE delayed the occurrence of tumor. (H) EE effects on biomarkers in serum. Sera were collected before tumor inoculation in the 6 week EE (n=20 in each group, * P<0.05). (I) B16 cells grew more slowly when cultured with serum from EE mice compared to control mice while pretreatment with leptin neutralizing antibody inhibited the effect of serum on B16 cell growth (n=4 in each group, * P<0.05 between groups as indicated). (J) Phospho-Akt1 (S473), ERK1 (T202/Y204)/ERK2 (T185/Y187), Phosphop38α (T180/Y182), active HIF-1α activity and VEGF concentration were significantly reduced in tumors from EE mice compared to control mice (n=7 in each group, * P<0.05). (K) The proliferative response of splenic lymphocytes to ConA was increased in EE mice before and after tumor inoculation (n=5 in each group at each time point, * P<0.05, + P=0.054). (L) NK cytotoxicity was higher in EE mice (n=5 in each group, P<0.05) before tumor inoculation. (M) CD8 T cell cytotoxicity was higher than control mice (bar represents a pool of 4 mice in each group, P<0.05).Values are means ± SEM. See also Figure S1.
Figure 2
Figure 2. Enriched environment induces gene expression changes in the hypothalamus distinctive to voluntary running
(A) Arcuate nucleus at 2, 4 and 9 weeks of EE. (B) VMH/DMH. (n=5 per group). (C) Running induced gene expression changes in the arcuate nucleus. (n=5 per group). P values of significance or strong trends are shown above the bars. (D) Running led to some changes in serum biomarkers which were distinctive to those observed in EE (n=16 in runners, n=13 in control mice, *P<0.05). (E) The proliferative response of splenic lymphocytes to the T-cell mitogen Con A was increased in runner (n=4 in each group, * P<0.05). (F) NK cytotoxicity was higher in runner (n=4 in each group, P<0.05) before tumor inoculation. (G) Running did not reduce tumor growth. (n=11 in runner, n=10 in control mice, P>0.05).Values are means ± SEM.
Figure 3
Figure 3. Hypothalamic gene delivery of BDNF mimics enriched environment associated metabolic changes and melanoma resistance
(A) Experimental design of BDNF overexpression in the hypothalamus. (B) Transgene expression in hypothalamus: GFP fluorescence and immunofluorescence of HA tag (human BDNF has HA tag at 3′ terminal). (C) BDNF overexpression led to serum biomarker changes similar to that found in EE (n=10 in BDNF mice, n=16 in GFP mice, *P<0.05). (D) B16 cells grew more slowly when cultured with serum from BDNF mice compared to GFP mice 4 weeks after AAV injection (n=5 in each group, * P<0.05). (E) The proliferative response of splenic lymphocytes to the T-cell mitogen Con A was increased in BDNF mice (n=3 in each group, * P<0.05). (F) BDNF overexpression reduced tumor weight d 17 after inoculation (n=10 in BDNF mice, n=16 in GFP mice, * P<0.05). Values are means ± SEM.
Figure 4
Figure 4. Hypothalamic BDNF knockdown inhibits enriched environment induced tumor resistance
(A) Experimental design of RNAi knockdown of hypothalamic BDNF expression. (B) Quantitative RT-PCR. The miR-Bdnf vector significantly reduced hypothalamic BDNF mRNA levels in mice housed in both control and EE condition (n=7-17 per group, * P<0.01 miR-Bdnf compared to miR-scr in both of control housing and EE, + P=0.061 miR-scr EE compared to miR-scr control housing). (C) miR-Bdnf blocks EE-induced tumor resistance. * P<0.05, miR-scr EE vs. all other groups, con: control housing, EE: EE housing. (D) Biomarkers in serum 4 weeks after AAV injection and 3 weeks EE (* P<0.05 miR-scr EE vs. all other groups, + P<0.05 between groups as indicated). Values are means ± SEM. See also Figure S2.
Figure 5
Figure 5. Sympathetic regulation of WAT adipokine expression via β-ARs serves as a peripheral pathway of the enriched environment -associated anti-cancer phenotype
(A) EE induced gene expression changes in WAT of mice living in EE for 9 weeks (n=5 per group). P values of significance were shown above bars. (B, C) Propranolol completely blocked EE effects on serum biomarkers and melanoma growth (n=20 per group). (D, E) Administration of leptin-releasing liposomes attenuated the EE-associated leptin drop in circulation and inhibited the EE effect on tumor growth (n=10 per group). * P<0.05 compared to mice receiving vehicle and living in control housing. (F) EE or hypothalamic overexpression of BDNF failed to inhibit melanoma growth in ob/ob mice (n=10 per group) as observed in wild type mice (* P<0.05 between groups as indicated). (G) EE inhibited tumor growth in obese DIO mice (n=15 per group, * P<0.05 compared to control housing). (H) Correlation of tumor weight of individual mouse in the DIO experiment with basal serum leptin level before tumor implantation (n=28). (I) Leptin replacement enhanced melanoma growth in ob/ob mice compared to pair-fed saline infused mice. (n=10 per group, * P<0.01 compared to saline infused mice). Values are means ± SEM. See also Figure S3.
Figure 6
Figure 6. Enriched environment inhibits colon cancer growth when commenced after MC38 implantation and suppresses intestinal tumorigenesis in ApcMin/+ mice
(A) Experimental design of the minimal disease model. (B) In the minimal disease MC 38 model, EE significantly reduced tumor weight (n=20 per group, * P<0.05). (C) EE affects biomarkers in the minimal disease model (n=20 per group, * P<0.05). (D) Experimental design of the established MC38 model. (E) In the established tumor model, EE commenced after visible tumor occurred reduced tumor growth rate (n=6 per group, * P<0.05). (F) EE decreased tumor weight d 24 after tumor inoculation (n=6 per group, * P<0.05). (G) Serum biomarkers in ApcMin/+ mice after 3 weeks EE (n=15 per group, *P<0.05). (H) Total number of visible tumors larger than 1 mm in diameter (n=15 EE, n=14 control, P=0.01). (I) EE reduced the size of polyps in small intestine (*P<0.05). (J) EE reduced splenomegaly (n=15 EE, n=14 control, P<0.01). (K) EE reduced triglyceride level (n=15 EE, n=14 control, P<0.01).Values are means ± SEM.
Figure 7
Figure 7. Mechanism of enriched environment -induced tumor resistance
See Discussion for details.

Comment in

Similar articles

Cited by

References

    1. Aaronson SA. Growth factors and cancer. Science. 1991;254:1146–1153. - PubMed
    1. Barb D, Williams C, Neuwirth AK, Mantzoros CS. Adiponectin in relation to malignancies: a review of existing basic research and clinical evidence. Am. J. Clin. Nutr. 2007;86:858s–866s. - PubMed
    1. Bariohay B, Lebrun B, Moyse E, Jean A. Brain-derived neurotrophic factor pays a role as an anorexigenic factor in the dorsal vagal complex. Endocrinology. 2005;146:5612–5620. - PubMed
    1. Bartness TJ, Song CK. Brain-adipose tissue neural crosstalk. Physiol. Behav. 2007;91:343–351. - PMC - PubMed
    1. Benaroya-Milshtein N, Hollander N, Apter A, Kukulansky T, Raz N, Wilf A, Yaniv I, Pick CG. Environmental enrichment in mice decrease anxiety, attenuates stress responses and enhances natural killer cell activity. Eur. J. Neurosci. 2004;20:1341–1347. - PubMed

Publication types

MeSH terms