. 2010 Jul 9;142(1):133-43.
doi: 10.1016/j.cell.2010.05.028.

TIF1gamma controls erythroid cell fate by regulating transcription elongation

Affiliations

TIF1gamma controls erythroid cell fate by regulating transcription elongation

Xiaoying Bai et al. Cell. .

Abstract

Recent genome-wide studies have demonstrated that pausing of RNA polymerase II (Pol II) occurred on many vertebrate genes. By genetic studies in the zebrafish tif1gamma mutant moonshine we found that loss of function of Pol II-associated factors PAF or DSIF rescued erythroid gene transcription in tif1gamma-deficient animals. Biochemical analysis established physical interactions among TIF1gamma, the blood-specific SCL transcription complex, and the positive elongation factors p-TEFb and FACT. Chromatin immunoprecipitation assays in human CD34(+) cells supported a TIF1gamma-dependent recruitment of positive elongation factors to erythroid genes to promote transcription elongation by counteracting Pol II pausing. Our study establishes a mechanism for regulating tissue cell fate and differentiation through transcription elongation.


Figures

Figure1
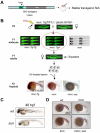
Figure1. Genetic suppressor screen in the mon mutant
A) Scheme of generating viable mon transgenic fish using a BAC transgene. B) Scheme of the suppressor screen. BAC transgenic fish are green fluorescent. In F1 generation, three groups of embryos were obtained: transgene homozygous (mon; Tg/Tg), transgene heterozygous (mon; Tg/+), and embryos with no transgene (mon). Only transgene heterozygous (in the red circle) were raised up to adults. Double in situ hybridization of GFP and βe3 globin was performed on F2 haploid embryos. Note the GFP staining on mon; Tg haploids (strong in the head and weak throughout the body) but not on haploids lacking the transgene. “sup” indicates a suppressor mutation. C) Morphology of the sunrise mutant at 48hpf. D) In situ hybridization of βe3 globin at 22hpf. See also Figure S1.
Figure 2
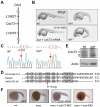
Figure 2. The defective gene in sunrise is cdc73
A) The sunrise locus was mapped on chromosome 2 between the microsatellite marker z19837 and z13475. The cdc73 gene is located within this region. B) The morphology of wild type, sun mutant and rtf1−/− mutant at 36hpf. Injection of cdc73 mRNA completely (12 out of 12 embryos) rescued the morphology of sun mutants. C) DNA sequence chromatograms showing the C→T transition at +1507 in cdc73 coding region in sun homozygous mutant, leading to a premature stop codon (in the red box). D) Alignment of the C-terminal CDC73 protein sequence from Drosophila, human and zebrafish. The nonsense mutation in sun mutant is indicated by a red arrow. E) Western blot showing the loss of CDC73 protein in sun mutant. Protein was extracted from 36hpf embryos. Red asterisk: zebrafish CDC73 (~64kD). Black asterisk: non-specific bands. Actin is used as a loading control. F) Morpholino (MO)-mediated knockdown of cdc73 completely rescues globin expression in mon (22 out of 22 embryos), whereas 5-bp mismatch control morpholino has no rescue (0 out of 13 embryos)
Figure 3
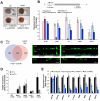
Figure 3. TIF1γ and PAF antagonistically regulates erythroid gene expression
A) In situ hybridization of βe3 showing rescue of mon by depleting other PAF subunits. A 5-bp mismatch control morpholino for ctr9 was used in (vi). Rescue frequency (%) was shown in iii-v. B) Scheme of using gata1:GFP transgenic line to get RNA from erythroid cells in 12 somite-stage (12ss) zebrafish embryos. C) Real-time RT-PCR analyses to compare the expression of blood genes in GFP+ cells between wildtype and morphants. Results are shown as fold change relative to the wildtype control and normalized to expression of β-actin. The results presented as mean ± SD from three independent experiments. D) Microarray analysis to compare erythroid gene expression in gata1-GFP+ cells from morphants. Left: heat map of 243 erythroid signature genes. Right: a close-up look of average fold change of top 20% (a) and bottom 20% genes (b) from the heat map on the left. All microarray data have been deposited in the NCBI’s GEO database under the accession number GSE20432. See also Fig S2.
Figure4
Figure4. tif1γ-deficiency reduces the level of full-length transcripts of blood genes
A) Morpholino knockdown of Rad6 and mRNA processing factors could not rescue βe3 globin expression in mon. In situ hybridization of βe3 globin was performed at 22hpf. See also Figure S3. B) Top: A schematic diagram showing the position of primers used in real-time RT-PCR analyses. Primers for the 5′ transcripts are located within 120bp from transcription start site (TSS), and primers for the 3′ transcripts are in the 3′ coding region or 3′UTR. Bottom: real-time RT-PCR analyses to compare the level of 5′ (light pink and light blue) and 3′ (dark pink and dark blue) transcripts of selected genes between wildtype cells and morpholino knockdown cells. RNA was prepared as in Figure 3B. Results are shown as average fold change (mean ± SD) from three independent experiments, normalized to the level of the 5′ transcript of β-actin. C) TIF1γ and CDC73 share common gene targets. Left: ChIP-Chip in K562 cells revealed a subset of gene targets shared between TIF1γ and CDC73. The significance of overlapping was evaluated by a hypergeometric distribution test. Right: ChIP-Chip at gata1 and gata2 locus. The transcription direction was indicated by white arrows. The raw dataset is available on NCBI’s GEO database under the accession number GSE20428. D) TIF1γ and CDC73 ChIP in human CD34+ cells after 5 days of erythroid differentiation (proerythroblast stage). Results were normalized to the background level that was determined by ChIP without antibody. An inactive gene TRO (tropinin) was used as the negative control. The results are shown as mean ± SD from three independent experiments. E) Real-time RT-PCR to compare erythroid gene expression between uninfected and infected CD34+ cells with indicated shRNA constructs. EV: empty vector. Data are represented as fold change relative to expression levels in uninfected cells. The results are shown as mean ± SD from three independent experiments.
Figure 5
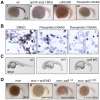
Figure 5. Effects of FACT, p-TEFb and DSIF on erythropoiesis
A) Reduced erythropoiesis by inhibiting FACT and p-TEFb. In situ hybridization of βe3 was performed on 22hpf zebrafish embryos treated with morpholino injection (ii & iii) or 35uM flavopiridol (iv). See also Figure S4. B) Flavopiridol treatment blocks erythroid differentiation of human CD34+ cells. Cells were harvested at d11 after differentiation (close to terminal differentiation stage), stained for benzidine (brown) and counter-stained with May-Grunwald (blue). C) Similar morphology of sun mutants and spt5 morphants at 36hpf. D) Rescue of mon mutants by spt5 morpholino and mutants, shown by in situ hybridization of βe3 globin at 22hpf. Note the rescue efficiency was 100% in each case (ii, iii and iv).
Figure 6
Figure 6. TIF1γ is required to recruit positive elongation factors to erythroid genes
A) The western blot showing the expression of Flag-tagged human TIF1γ in stably transfected K562 cells. Red asterisk: Flag-tagged h TIF1γ. Black asterisk: endogenous hTIF1γ. B) Colloidal-Coomassie blue staining showing proteins pulled down by anti-Flag antibody from untransfected K562 cells and cells stably expressing Flag-tagged TIF1γ. Flag-tagged TIF1γ is indicated by a red asterisk. C) The factors from the SCL complex and the FACT complex identified in the mass spectrometry analyses following anti-Flag pull-down. The numbers of peptides were summarized from six independent experiments. See also Table S1. D) K562 nuclear extracts were immunoprecipitated (IP) and subsequently immunoblotted (IB) with indicated antibodies. Corresponding IgG was used as the negative control. Note CDC73 and SPT5 do not co-IP with TIF1γ or SCL. DDX17 was used as a negative control to show the specificity of co-IP experiments. See also Figure S5. E) CDK9 ChIP in human CD34+ cells infected with empty vector (EV) or tif1γ-shRNAs. Cells were harvested after 5 days of erythroid differentiation (proerythroblast stage). Results are shown as fold enrichment compared to the background level that is determined by no-antibody ChIP. The results are shown as mean ± SD from two independent experiments.
Figure 7
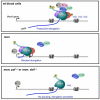
Figure 7. Model of TIF1γ regulating transcription elongation of blood genes
In wildtype blood cells, Pol II elongation on blood-specific genes is inhibited by PAF and DSIF. TIF1γ is required to release paused Pol II by recruiting p-TEFb and FACT to blood genes through interacting with the SCL complex. The kinase activity of p-TEFb phosphorylates DSIF and Pol II CTD. Phosphorylated Pol II then proceeds to finish elongation. In mon mutant blood cells, recruitment of p-TEFb and FACT is not efficient in the absence of TIF1γ, which in turn affects Pol II phosphorylation and releasing from the paused state, resulting in elongation blockage. In double mutant cells missing both TIF1γ and DSIF/PAF, Pol II is no longer paused, elongation will continue even without help from positive elongation factors.

Comment in

Similar articles

Cited by

References

    1. Chao SH, Price DH. Flavopiridol inactivates P-TEFb and blocks most RNA polymerase II transcription in vivo. J Biol Chem. 2001;276:31793–31799. - PubMed
    1. Chen H, Contreras X, Yamaguchi Y, Handa H, Peterlin BM, Guo S. Repression of RNA polymerase II elongation in vivo is critically dependent on the C-terminus of Spt5. PLoS One. 2009;4:e6918. - PMC - PubMed
    1. Cheng B, Price DH. Properties of RNA polymerase II elongation complexes before and after the P-TEFb-mediated transition into productive elongation. J Biol Chem. 2007;282:21901–21912. - PubMed
    1. Choe SE, Boutros M, Michelson AM, Church GM, Halfon MS. Preferred analysis methods for Affymetrix GeneChips revealed by a wholly defined control dataset. Genome Biol. 2005;6:R16. - PMC - PubMed
    1. Dupont S, Mamidi A, Cordenonsi M, Montagner M, Zacchigna L, Adorno M, Martello G, Stinchfield MJ, Soligo S, Morsut L, et al. FAM/USP9x, a deubiquitinating enzyme essential for TGFbeta signaling, controls Smad4 monoubiquitination. Cell. 2009;136:123–135. - PubMed

Publication types

Substances

Associated data