Comparative Study
. 2010 Jul 9;142(1):158-69.
doi: 10.1016/j.cell.2010.05.037.

A comprehensive comparison of transmembrane domains reveals organelle-specific properties

Affiliations
Comparative Study

A comprehensive comparison of transmembrane domains reveals organelle-specific properties

Hayley J Sharpe et al. Cell. .

Abstract

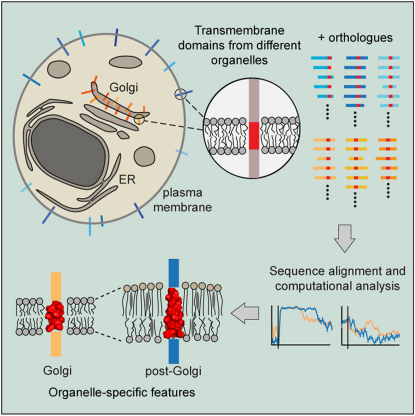
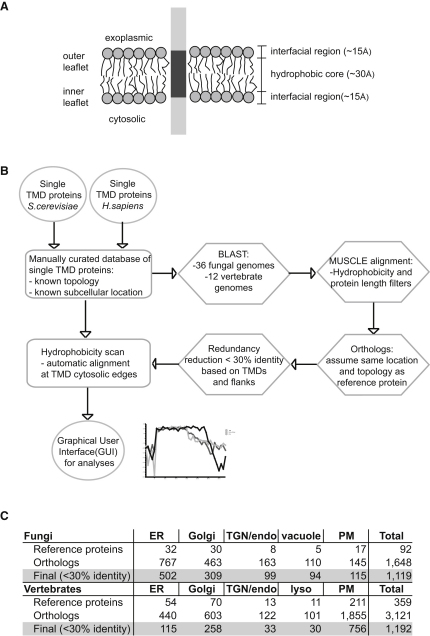
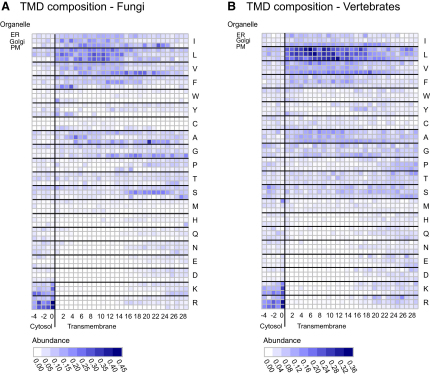
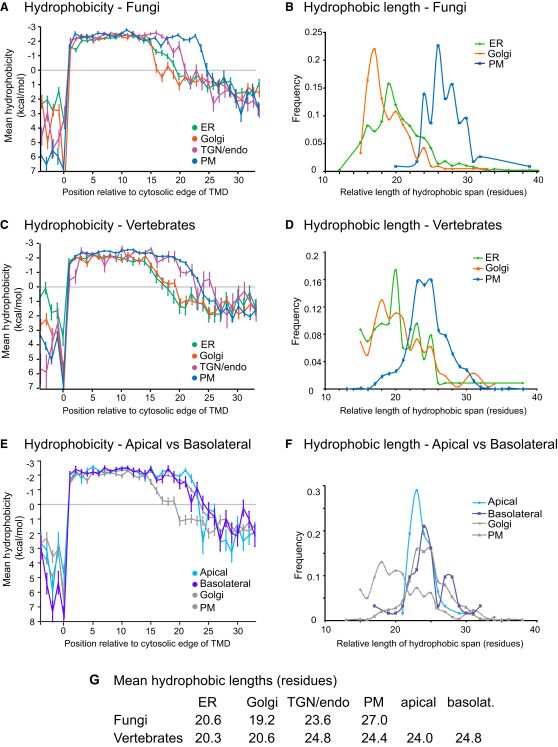
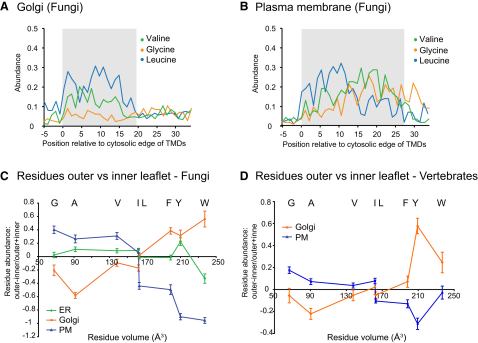
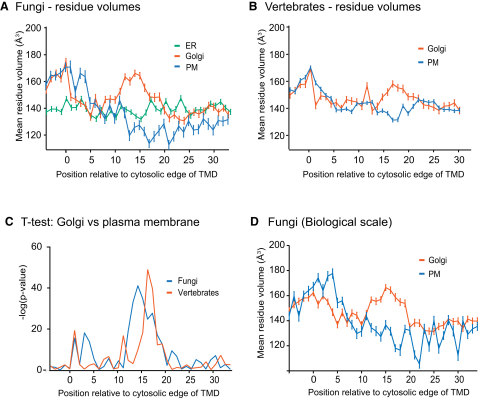
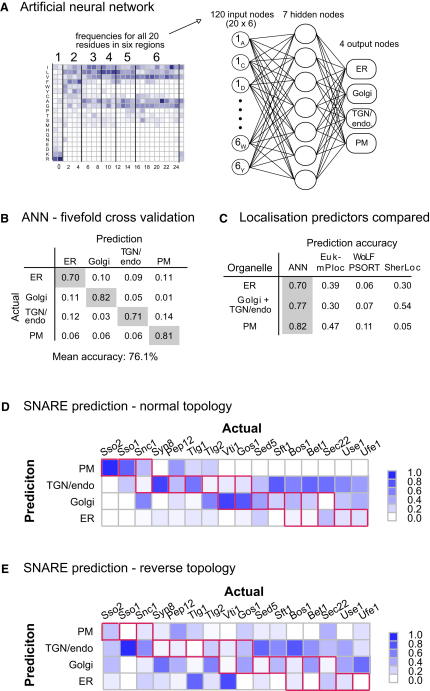
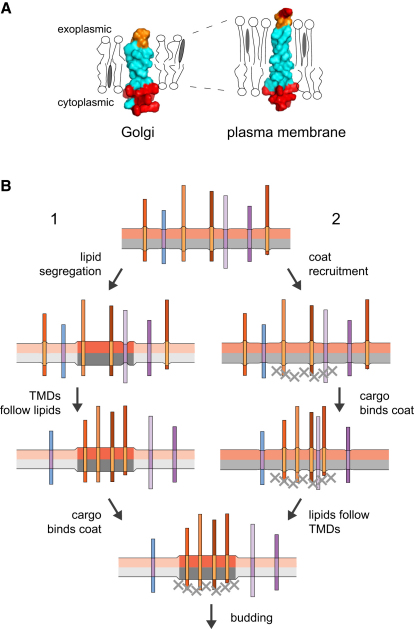
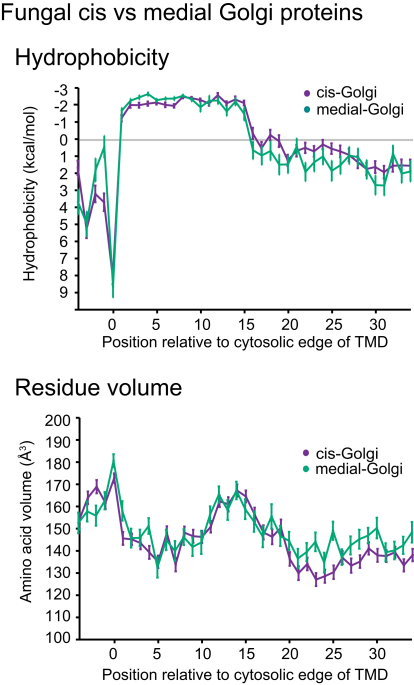
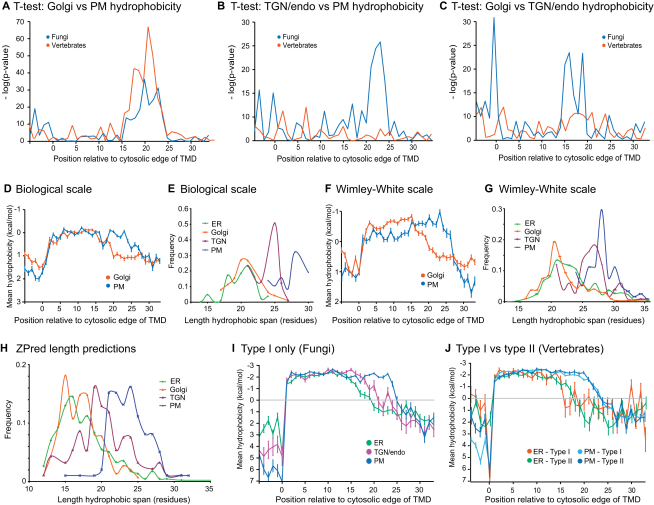
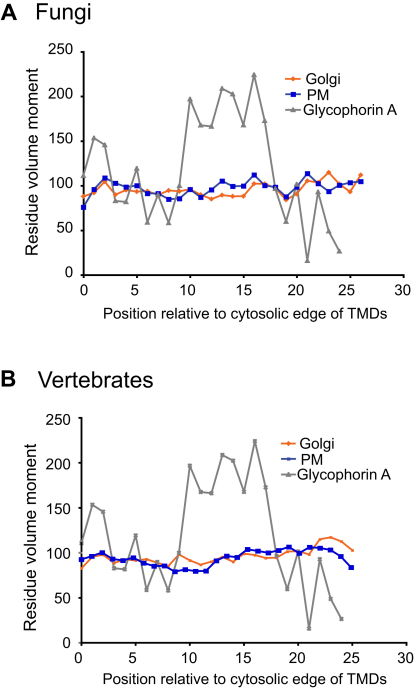
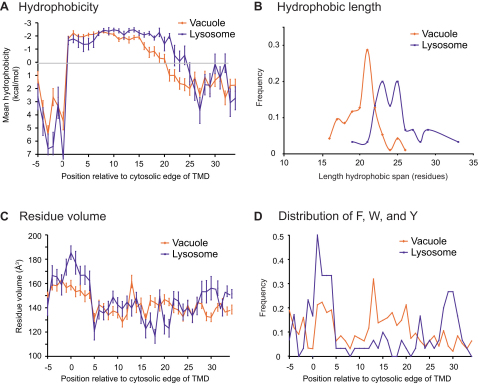
The various membranes of eukaryotic cells differ in composition, but it is at present unclear if this results in differences in physical properties. The sequences of transmembrane domains (TMDs) of integral membrane proteins should reflect the physical properties of the bilayers in which they reside. We used large datasets from both fungi and vertebrates to perform a comprehensive comparison of the TMDs of proteins from different organelles. We find that TMDs are not generic but have organelle-specific properties with a dichotomy in TMD length between the early and late parts of the secretory pathway. In addition, TMDs from post-ER organelles show striking asymmetries in amino acid compositions across the bilayer that is linked to residue size and varies between organelles. The pervasive presence of organelle-specific features among the TMDs of a particular organelle has implications for TMD prediction, regulation of protein activity by location, and sorting of proteins and lipids in the secretory pathway.


Figures

None
Graphical abstract
Figure 1
Figure 1
Overview of the Methodology for TMD Analysis (A) Schematic of a typical single-pass or bitopic protein embedded in a lipid bilayer. (B) Bitopic proteins of known topology and location from S. cerevisiae and H. sapiens were identified by literature and database searches. Orthologous proteins were identified using BLAST and aligned with the reference proteins. The starts of the TMDs were identified by a hydrophobicity scanning algorithm and used to align the TMDs at their cytosolic edges. (C) The number of proteins from the indicated organelles that were used in the analyses of TMDs (PM, plasma membrane). Redundancy reduction was such that TMDs and flanking sequences have <30% identity. Reference proteins are listed in Table S1 and Table S2. See also Figure S1.
Figure 2
Figure 2
Positional Analysis of Amino Acid Composition of TMDs from Different Organelles in Fungi and Vertebrates (A and B) The position relative to the cytosolic edge of the TMDs is on the horizontal axes, and the amino acids and organelles are on the vertical axes. Amino acids are listed in order of decreasing hydrophobicity (Goldman-Engelman-Steitz [GES] scale [Engelman et al., 1986]). Normalized residue abundance is color-coded such that white represents zero and dark blue a maximum of one. The abundance of serines in the region following the lumenal end of Golgi TMDs probably reflects the fact that this part of many Golgi enzymes forms a flexible linker that tethers the catalytic domain to the membrane (Paulson and Colley, 1989). Graphical plots for individual residues can be generated at http://www.tmdsonline.org. See Table S3 and Table S4 for numerical values.
Figure 3
Figure 3
Positional Analysis of TMD Hydropathy from Different Organelles in Fungi and Vertebrates (A) The mean hydrophobicity (GES scale) of the residues at each position along the aligned TMDs relative to the cytosolic edge was plotted for the indicated protein sets from fungi. The hydrophobicity values represent the free energy for partitioning from water into a hydrophobic environment, and therefore negative values indicate a preference for the interior of a lipid bilayer. Bars show standard error of mean. (B) The distribution of TMD lengths for fungal organelles. The exoplasmic ends of the TMD were defined using the hydrophobicity scanning algorithm as for the cytosolic ends. (C and D) As for (A) and (B), but for vertebrate proteins. (E and F) As for (C) and (D), but for vertebrate proteins of the apical and basolateral domains of the plasma membrane. The Golgi and total plasma membrane plots from (C) and (D) are included for comparison. The 15 apical and 12 basolateral reference proteins are listed in Table S2. (G) The mean values for the TMD hydrophobic lengths of the indicated organelles shown in (B) and (D). For fungi, the differences between Golgi and TGN, Golgi and plasma membrane (PM), and TGN and PM are statistically significant (p < 10−12, two sample t tests), whereas for vertebrates this was the case for Golgi and TGN and Golgi and PM (p < 10−10) but not TGN and PM. See also Figure S2 for tests of robustness and significance of data.
Figure 4
Figure 4
Analysis of the Compositional Asymmetry of TMDs from Different Organelles of Fungi and Vertebrates (A and B) Analysis of the abundance of valine, glycine, and leucine along the TMDs from Golgi and plasma membrane proteins of fungi. Shaded areas represent the mean length of the hydrophobic regions for each protein set (Figure 3G). (C and D) Analysis of amino acid asymmetry in ER, Golgi, and plasma membrane (PM) TMDs from fungi and in Golgi and plasma membrane TMDs from vertebrates. The abundance of each residue in the “inner” leaflet was subtracted from the abundance in the “outer” leaflet and divided by the total abundance to give a ratio of leaflet preference (0 = no preference). Leaflet position was defined by dividing the mean hydrophobic length for each organelle into two equal parts, and values for the different residues are plotted along the x axis according to residue volume. Error bars represent the standard error of the mean.
Figure 5
Figure 5
Positional Analysis of Amino Acid Volume from Different Organelles in Fungi and Vertebrates (A and B) The mean values for residue volume (Pontius et al., 1996), at each position along the TMDs from fungi and vertebrates. Error bars indicate standard error of the mean. (C) Independent (two sample) t tests were applied at positions along the TMDs to assess the significance of differences between the mean values of amino acid volumes for Golgi and plasma membrane proteins shown in (A) and (B). (D) The Biological scale of Hessa and coworkers was used to define cytosolic TMD edges and thus align the TMDs from different organelles at their cytosolic ends (Hessa et al., 2005). This alignment was then used for analysis of amino acid volume along the fungal Golgi and plasma membrane TMDs. Error bars indicate standard error of the mean. See also Figure S3.
Figure 6
Figure 6
An Artificial Neural Network Classifier of Subcellular Location Based on TMD Sequence (A) Overview of the neural network used for classifying proteins. The compositions of six regions along the TMDs from each fungal organelle set were encoded into input vectors to train the network. (B) Test of the accuracy of the ability of the neural network to predict localization. Performance was assessed using a 5-fold “leave-one-out” cross-validation in which groups of proteins were removed from the training set and then used to test the network trained with the remaining proteins. The predicted location was that with the highest score, with a mean accuracy calculated over all proteins in each set. (C) A comparison of predictive accuracy of the network (ANN) to that of existing subcellular localization prediction methods when applied to the S. cerevisiae reference proteins. (D and E) Prediction of SNARE localization using the neural network trained on TMD regions. The SNAREs from S. cerevisiae and 36 other fungi were examined with the network trained on the datasets that do not include the SNAREs, and the frequencies of predictions were normalized and plotted in a matrix against subcellular locations. Red boxes indicate the experimentally determined localizations of the SNAREs. SNARE TMD sequences were reversed prior to analysis in (E).
Figure 7
Figure 7
Organelle-Specific TMDs and Their Relationship with the Lipid Bilayer (A) Consensus TMDs from the fungal Golgi and plasma membrane datasets based on the most abundant residue at each position. Residues were modeled on an α helix using PyMOL. Hydrophobic residues (AGILVFWY) are colored cyan, polar residues (HNQST) orange, and basic residues (KR) red. The representation of the bilayer assumes that the plasma membrane is thicker and has a higher content of saturated lipids and sterols in the outer leaflet than do Golgi membranes. (B) Sorting of proteins sharing distinct TMD properties could either be driven by lipid sorting or could drive lipid sorting. For example, a domain of thicker, more ordered lipids could attract proteins with longer TMDs, and these could then attract a coat (1). Alternatively, if the cargo proteins for a particular class of vesicle have longer TMDs than the resident proteins, then their collection by coat into a forming transport carrier could affect the lipid composition around them, which would sort lipids and exclude residents with shorter TMDs (2). Either system could alternatively act on short TMDs if they were collected into vesicle by coats or segregated into thinner domains. See also Figure S4.
Figure S1
Figure S1
Properties Shared between TMDs from Early and Late Golgi, Related to Figure 1 Fungal proteins from the early (cis) and later (medial) parts of the Golgi data set were analyzed by plots of mean residue hydrophobicity and amino acid volume. Error bars indicate standard error of the mean.
Figure S2
Figure S2
Analysis of the Significance and Robustness of Organelle-Specific Differences in TMD Hydropathy Plots, Related to Figure 3 (A, B, and C) Independent (two sample) t tests were used to compare the mean residue hydrophobicity of residues at positions along the TMDs of proteins from (A) the Golgi and plasma membrane (PM); (B) TGN/endosomes and plasma membrane (PM); and (C) the Golgi and TGN/endosomes. (D) Positional analysis of mean hydrophobicity of the Golgi and plasma membrane TMDs calculated using the Biological scale reported by Hessa and coworkers (Hessa et al., 2007). The Biological scale was also used to define cytosolic TMD edges and thus align the fungal TMDs from different organelles at their cytosolic ends. Error bars indicate standard error of the mean. (E) Distribution of apparent lengths of fungal TMDs calculated by using the Biological scale to also define both the cytosolic and exoplasmic TMD edges. (F and G) As for (D) and (E) except that the Wimley-White hydrophobicity scale was used to define the TMD edges and calculate the mean hydropathy at each position (Wimley and White, 1996). (H) Distribution of lengths of TMDs obtained from the output of the TMD prediction program Zpred2 (Papaloukas et al., 2008). TMDs with 10 flanking residues on either side were used as the input for Zpred2 and the output was parsed to give a TMD length for each protein. In all cases a similar trend is seen: ER and Golgi TMDs are generally shorter than plasma membrane TMDs, with the TGN/endosome set being intermediate. (I and J) Analysis of mean TMD hydropathy of proteins of different topology using the GES scale. Results are shown for type I fungal proteins from the ER, TGN/endosomes and plasma membrane (PM) datasets (I), and for vertebrate type I and type II proteins from the ER and plasma membrane datasets (J). Error bars indicate standard error of the mean.
Figure S3
Figure S3
Positional Analysis of Residue Size Moment, Related to Figure 5 (A and B) The size moment at each position of a protein was defined as being the sum of the vector of the volume of that residue and of the vectors of the volumes of the six residues on either side (i.e., a window of seven residues which approximates to two turns of an α helix—see Experimental Procedures). This moment was calculated at each position for each protein and mean values at each position determined for all the proteins in the same dataset. Glycophorin A dimerizes via a GXXXG motif in its TMD and serves as a positive control. The different datasets from the different organelles do not show large differences in size moment, and hence are not differentially enriched in GXXXG-like dimerization motifs.
Figure S4
Figure S4
A Comparison of the TMDs from the Fungal Vacuole and Vertebrate Lysosome, Related to Figure 7 (A) Positional analysis of mean hydrophobicity relative to the cytosolic ends of TMDs. (B) Distribution of relative TMD lengths. (C) Positional analysis of amino acid volume. (D) Abundance of aromatic residues (phenylalanine, tryptophan and tyrosine) along TMDs. Error bars in (A) and (C) indicate the standard error of the mean.

References

    1. Almén M.S., Nordström K.J.V., Fredriksson R., Schiöth H.B. Mapping the human membrane proteome: a majority of the human membrane proteins can be classified according to function and evolutionary origin. BMC Biol. 2009;7:50. - PMC - PubMed
    1. Altschul S.F., Madden T.L., Schaffer A.A., Zhang J., Zhang Z., Miller W., Lipman D.J. Gapped BLAST and PSI-BLAST: a new generation of protein database search programs. Nucleic Acids Res. 1997;25:3389–3402. - PMC - PubMed
    1. Andersen O.S., Koeppe R.E. Bilayer thickness and membrane protein function: an energetic perspective. Annu. Rev. Biophys. Biomol. Struct. 2007;36:107–130. - PubMed
    1. Bacia K., Schuette C.G., Kahya N., Jahn R., Schwille P. SNAREs prefer liquid-disordered over “raft” (liquid-ordered) domains when reconstituted into giant unilamellar vesicles. J. Biol. Chem. 2004;279:37951–37955. - PubMed
    1. Bondar A., del Val C., White S.H. Rhomboid protease dynamics and lipid interactions. Structure. 2009;17:395–405. - PMC - PubMed

Supplemental References

    1. Altschul, S.F., Gish, W., Miller, W., Myers, E.W., and Lipman, D.J. (1990). Basic local alignment search tool. J. Mol. Biol. 215, 403–410. - PubMed
    1. Chou, K.-C., and Shen, H.-B. (2007). Euk-mPLoc: a fusion classifier for large-scale eukaryotic protein subcellular location prediction by incorporating multiple sites. J. Proteome Res. 6, 1728–1734. - PubMed
    1. Decaens, C., Durand, M., Grosse, B., and Cassio, D. (2008). Which in vitro models could be best used to study hepatocyte polarity? Biol. Cell 100, 387–398. - PubMed
    1. Delacour, D., and Jacob, R. (2006). Apical protein transport. Cell. Mol. Life Sci. 63, 2491–2505. - PMC - PubMed
    1. Edgar, R.C. (2004). MUSCLE: multiple sequence alignment with high accuracy and high throughput. Nucleic Acids Res. 32, 1792–1797. - PMC - PubMed

Publication types

Substances