. 2010 Jul 9;39(1):100-9.
doi: 10.1016/j.molcel.2010.06.007.

The cytoplasmic adaptor protein Dok7 activates the receptor tyrosine kinase MuSK via dimerization

Affiliations

The cytoplasmic adaptor protein Dok7 activates the receptor tyrosine kinase MuSK via dimerization

Elisa Bergamin et al. Mol Cell. .

Abstract

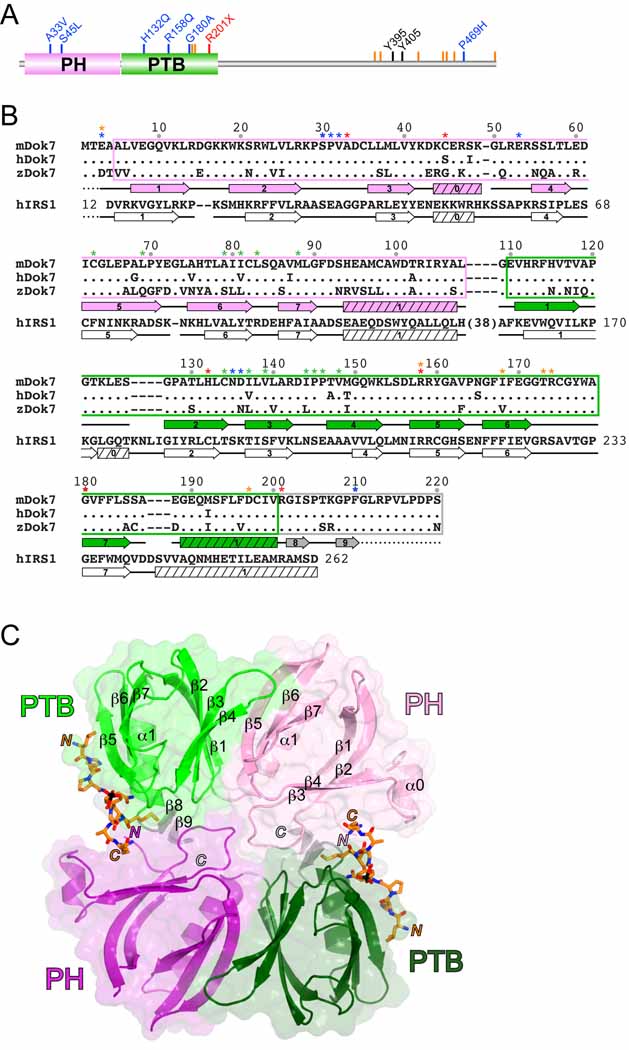
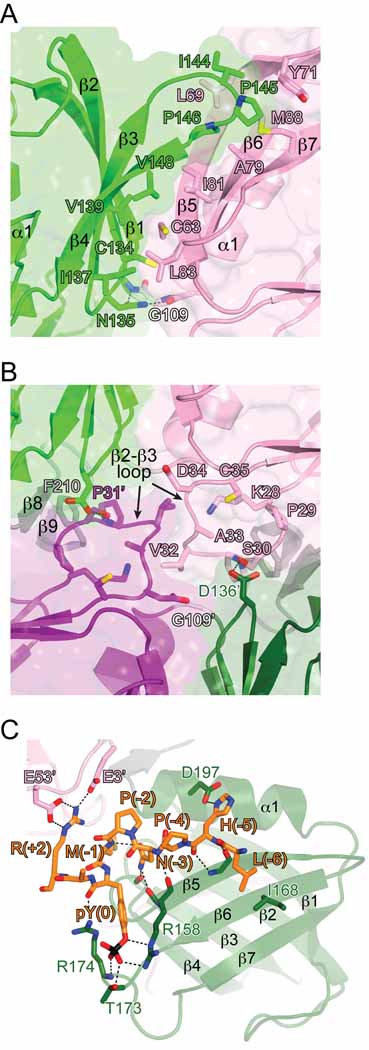
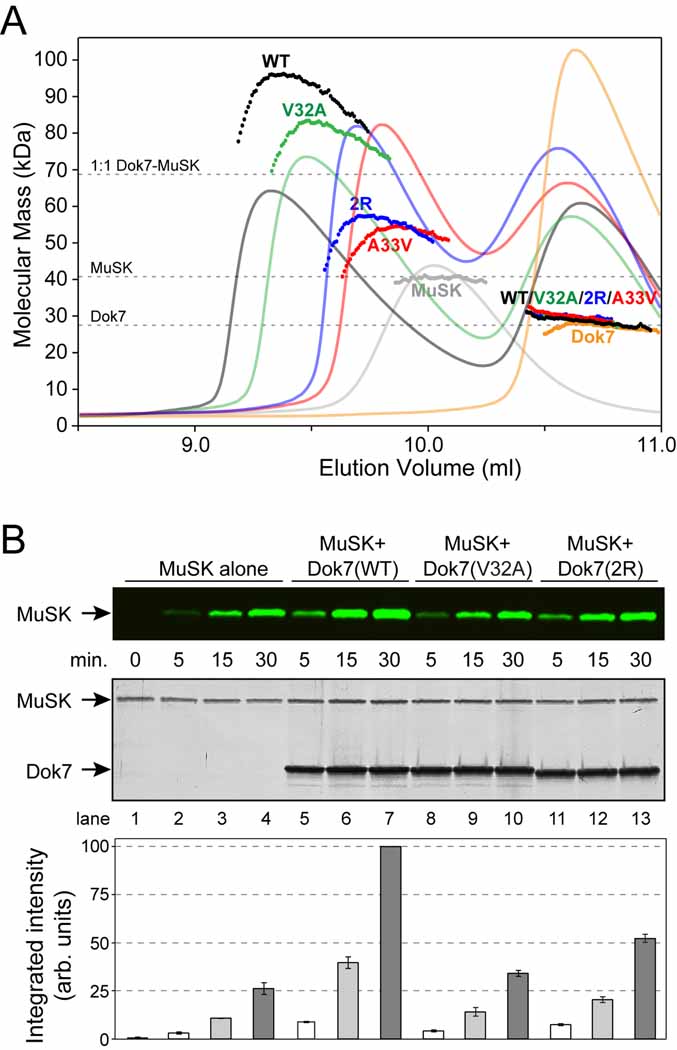
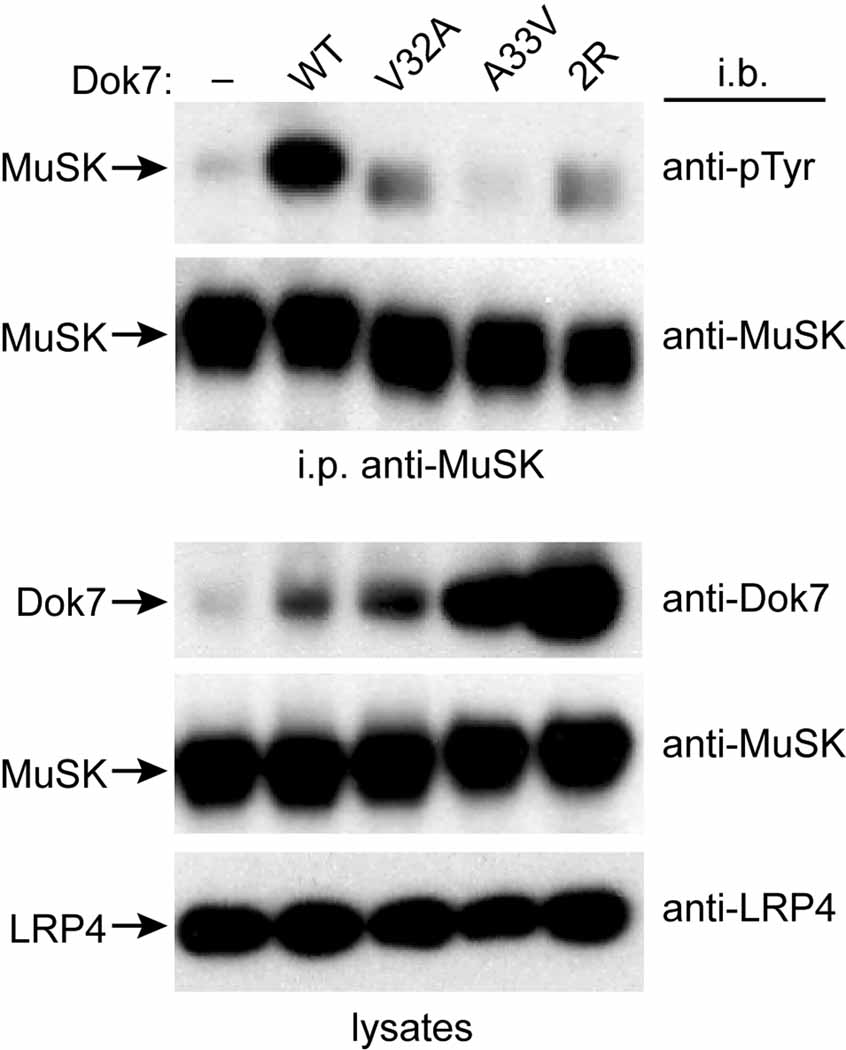
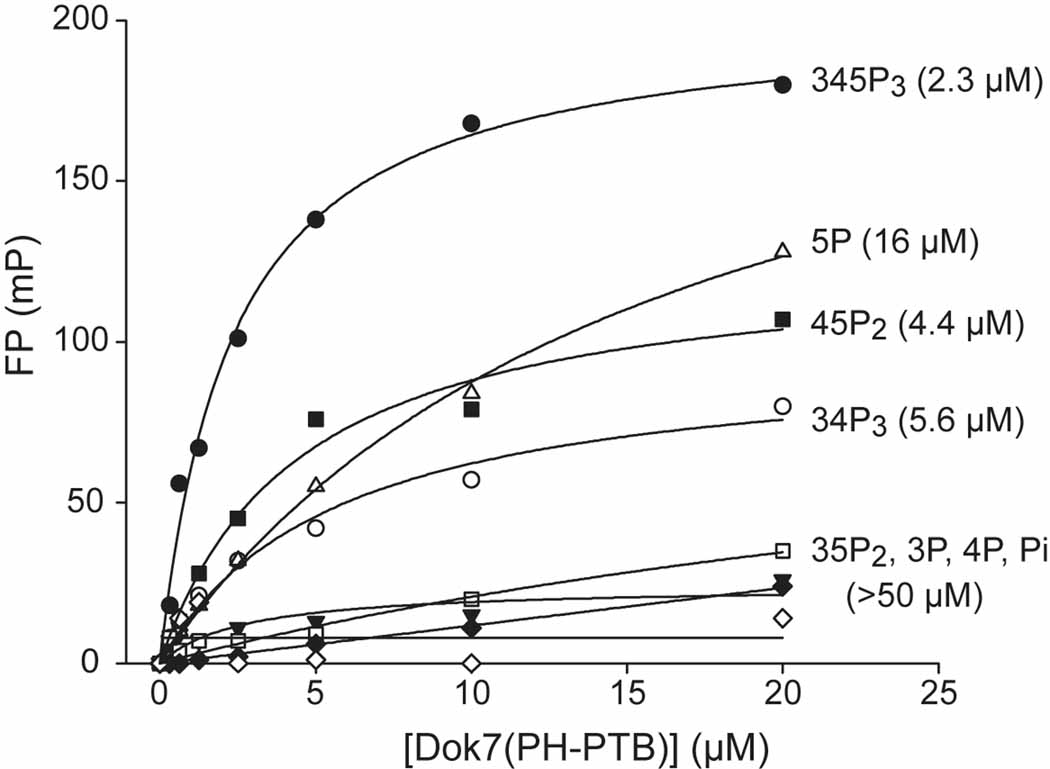
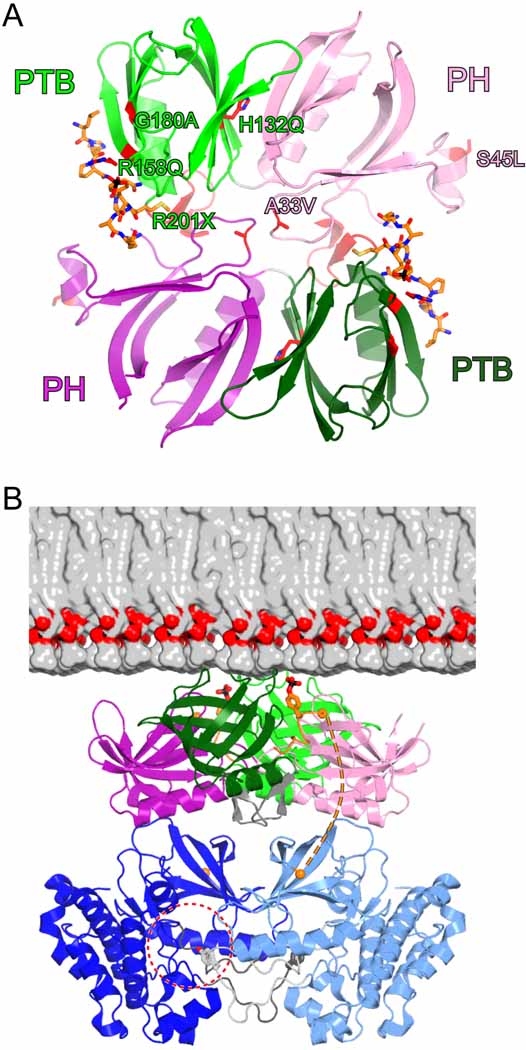
Formation of the vertebrate neuromuscular junction requires, among others proteins, Agrin, a neuronally derived ligand, and the following muscle proteins: LRP4, the receptor for Agrin; MuSK, a receptor tyrosine kinase (RTK); and Dok7 (or Dok-7), a cytoplasmic adaptor protein. Dok7 comprises a pleckstrin-homology (PH) domain, a phosphotyrosine-binding (PTB) domain, and C-terminal sites of tyrosine phosphorylation. Unique among adaptor proteins recruited to RTKs, Dok7 is not only a substrate of MuSK, but also an activator of MuSK's kinase activity. Here, we present the crystal structure of the Dok7 PH-PTB domains in complex with a phosphopeptide representing the Dok7-binding site on MuSK. The structure and biochemical data reveal a dimeric arrangement of Dok7 PH-PTB that facilitates trans-autophosphorylation of the kinase activation loop. The structure provides the molecular basis for MuSK activation by Dok7 and for rationalizing several Dok7 loss-of-function mutations found in patients with congenital myasthenic syndromes.


Figures

Figure 1
Figure 1. Crystal Structure of the Dok7(PH-PTB)-MuSK(pTyr553) Complex
(A) Domain architecture of human Dok7 drawn to linear scale (504 residues). The abbreviations are: PH, pleckstrin-homology (domain), and PTB, phosphotyrosine-binding (domain). The positions of CMS mutations are shown by blue (missense), red (nonsense), or orange (frame shift) lines and labels. The tyrosine phosphorylation sites are shown in black. (B) The sequences for the PH and PTB domains of mouse, human, and zebrafish Dok7 are shown along with the corresponding sequence for human IRS1. Residues in human and zebrafish Dok7 that are identical to those in mouse Dok7 are represented by a period. The PH domain is boxed in pink, the PTB domain is boxed in green, and the C-terminal extension to the PTB domain is boxed in gray, consistent with the coloring in Figure 1. Residue numbering is identical for mouse, human, and zebrafish Dok7. Residue numbering for human IRS1 is in-line with the sequence. Secondary-structure elements (α helices and β strands) for mouse Dok7(PH-PTB), as determined by PROCHECK (Laskowski et al., 1993), appear below the Dok7 sequences, and those for human IRS1(PH-PTB) (PDB code 1QQG) (Dhe-Paganon et al., 1999) appear below the IRS1 sequence. A dashed line indicates a disordered region. Residues denoted with a blue asterisk mediate Dok7(PH-PTB) dimerization, with a green asterisk mediate PH-PTB interactions, with an orange asterisk mediate MuSK pTyr553 binding, and with a red asterisk are CMS mutations. (C) Structure of the Dok7(PH-PTB)-MuSK(pTyr553) complex. The two Dok7(PH-PTB) protomers in the asymmetric unit are shown in ribbon representation, with one protomer colored pink (PH domain) and light green (PTB domain) and the second protomer colored purple (PH domain) and dark green (PTB domain). The C-terminal extension is colored gray in both copies. The molecular two-fold axis passes through the center, perpendicular to the plane of the figure. A semi-transparent molecular surface is shown for each PH-PTB protomer. The MuSK pTyr553 phosphopeptide is shown in stick representation with carbon atoms colored orange, oxygen atoms red, nitrogen atoms blue, sulfur atoms yellow, and phosphorus atoms black. Secondary-structure elements (α helices and β strands) for one of the PH-PTB protomers are labeled. The N- and C-termini of the two copies of the peptide and PH-PTB are labeled by ‘N’ and ‘C’ in the appropriate colors.
Figure 2
Figure 2. Molecular Interactions in the Dok7(PH-PTB)-MuSK(pTyr553) Structure
(A) View of the interface between the Dok7 PH and PTB domains. The viewing angle (down the molecular dyad axis) is the same as in Figure 1C. Side chains that mediate the interaction between the two domains are shown in stick representation. Carbon atoms are colored either pink (PH) or green (PTB), oxygen atoms are colored red, nitrogen atoms are colored blue, and sulfur atoms are colored yellow. Hydrogen bonds are represented by black dashed lines. Select secondary elements are labeled. (B) View of the Dok7 dimerization interface. The viewing angle is the same as in Figure 1C (two-fold axis is perpendicular to the plane of the figure), and the coloring scheme is the same as in (A). Residues in the β2-β3 loop of the PH domain and select other residues are shown in stick representation. Residues in the second protomer (dark colors) are labeled with an apostrophe. (C) Mode of MuSK pTyr553 binding to Dok7. The pTyr553 phosphopeptide is shown in stick representation, as are select residues from the PTB domain (dark green) and the PH domain (pink) from the other protomer (labeled with an apostrophe). Hydrogen bonds/salt bridges are represented by black dashed lines. See also Figure S1. Figures 1, 2, and 6 were rendered with PyMOL (http://pymol.sourceforge.net).
Figure 3
Figure 3. In Vitro Characterization of the Dok7(PH-PTB)-MuSK(cyto) Interaction
(A) A280 traces from the SEC runs are shown as colored solid lines, plotted on the same relative scale. The MALS-derived molecular mass distributions are plotted as individual points in the colors corresponding to the A280 traces, with the scale shown on the left-hand side. The samples analyzed were (Dok7=Dok7[PH-PTB] and MuSK=pMuSK[cyto]): MuSK + wild-type Dok7 (‘WT’, black), MuSK + Dok7 V32A (‘V32A’, green), MuSK + Dok7 A33V (‘A33V’, red), MuSK + Dok7 double-arginine mutant (‘2R’, blue), MuSK alone (‘MuSK’, gray), and wild-type Dok7 alone (‘Dok7’ orange). The dashed line at 68 kDa indicates the molecular mass of a 1:1 Dok7-MuSK complex. The molecular mass distributions in the second peak (labeled ‘WT/V32A/2R/A33V’), which represents excess Dok7, are nearly superimposable for the four Dok7-MuSK samples. (B) MuSK autophosphorylation assay. MuSK(cyto) was incubated with Mg-ATP in the absence (lanes 1–4) or presence of Dok7(PH-PTB) wild-type (lanes 5–7), V32A (lanes 8–10), or the R158Q/R174A mutant (2R, lanes 11–13). The top panel is an immunoblot with anti-MuSK pTyr754 antibodies visualized on an infrared imaging system. The middle panel shows the silver-stained gel of the reaction mixtures (loading controls), and the lower panel shows the quantification of the immunoblot in the top panel. The error bars represent the standard error from experiments done in triplicate. For each experiment, the highest intensity (lane 7) was scaled to 100 (hence, no error bar), then the data were averaged. The zero time point (lane 1) is prior to the addition of Mg-ATP and is only shown for the MuSK-alone sample. See also Figure S2.
Figure 4
Figure 4. Dok7-Mediated Activation of MuSK in NIH 3T3 Cells
Shown are immunoblots from Agrin-treated NIH 3T3 cells stably transfected with MuSK, LRP4, and wild-type Dok7 (WT), V32A, A33V, the double-arginine mutant (2R), or no Dok7 (−). The top two blots are from anti-MuSK immunoprecipitates (i.p.), and the bottom three blots are from lysates. The antibodies used for immunoblotting (i.b.) are listed on the right sides of the blots, and the protein identifications are listed on the left sides. As can be seen in the anti-Dok7 immunoblot of the lysates (top lysate blot), the levels of Dok7 vary in the different stably transfected cell lines, but in all cases the mutant Dok7 level is greater than or equal to the wild-type level.
Figure 5
Figure 5. Phosphoinositide Binding to Dok7(PH-PTB)
Fluorescence-polarization measurements (millipolarization [mP] versus protein concentration) of phosphoinositide binding to mouse Dok7(PH-PTB). Fits are based on a saturable, single-site binding model. Kd values (in µM) extracted from the fits are given in parentheses to the right of the headgroup labels.
Figure 6
Figure 6. CMS Mutations and Model for Dok7-Facililated MuSK Activation
(A) CMS missense and nonsense mutations are mapped onto the Dok7(PH-PTB) structure, shown as a ribbon diagram. The side chains of the wild-type protein affected by mutation are shown in stick representation, with carbon atoms colored red. The residues in only one protomer are labeled. The ribbon is colored red for residues 201–210, which are deleted as a consequence of the R201X nonsense mutation. (B) The structure of the 2:2 Dok7(PH-PTB):MuSK(pTyr553) complex is colored as in Figure 1B, with pTyr553 shown in stick representation. The view is approximately 90° from the view in (A). Half of a bilayer consisting of 1-palmitoyl-2-oleoyl-phosphatidylcholine is shown to scale. Two MuSK kinase domains (light and dark blue) are represented by the dimer of trans-autophosphorylating kinase domains of the insulin-like growth factor-1 receptor (IGF1R) (Wu et al., 2008). In this symmetric dimeric configuration (two-fold axis is vertical, perpendicular to the bilayer plane), Tyr1135 in the IGF1R activation loop, corresponding to Tyr754 in MuSK, is bound in the active site of the other kinase domain (dashed-red circle). The activation loop is colored either light gray (corresponding to the light-blue kinase) or dark gray (corresponding to the dark-blue kinase), with Tyr1135 (Tyr754) shown in stick representation. The orange spheres denote the Cα positions at the end of the pTyr553 peptide (Arg555) and at the beginning of the MuSK kinase domain (Tyr569). In this manually assembled model, the distance between these two residues is 34 Å.

References

    1. Beeson D, Webster R, Cossins J, Lashley D, Spearman H, Maxwell S, Slater CR, Newsom-Davis J, Palace J, Vincent A. Congenital myasthenic syndromes and the formation of the neuromuscular junction. Ann. NY Acad. Sci. 2008;1132:99–103. - PubMed
    1. Brünger AT, Adams PD, Clore GM, DeLano WL, Gros P, Grosse-Kunstleve RW, Jiang JS, Kuszewski J, Nilges M, Pannu NS, et al. Crystallography & NMR system: A new software suite for macromolecular structure determination. Acta Crystallogr. D. 1998;54:905–921. - PubMed
    1. Burden SJ. Building the vertebrate neuromuscular synapse. J. Neurobiol. 2002;53:501–511. - PubMed
    1. Cai D, Dhe-Paganon S, Melendez PA, Lee J, Shoelson SE. Two new substrates in insulin signaling, IRS5/DOK4 and IRS6/DOK5. J. Biol. Chem. 2003;278:25323–25330. - PubMed
    1. Depetris RS, Wu J, Hubbard SR. Structural and functional studies of the Ras-associating and pleckstrin-homology domains of Grb10 and Grb14. Nat. Struct. Mol. Biol. 2009;16:833–839. - PMC - PubMed

Publication types

MeSH terms

Associated data