. 2010 Jul 9;39(1):121-32.
doi: 10.1016/j.molcel.2010.06.029.

Imaging interorganelle contacts and local calcium dynamics at the ER-mitochondrial interface

Affiliations

Imaging interorganelle contacts and local calcium dynamics at the ER-mitochondrial interface

György Csordás et al. Mol Cell. .

Abstract

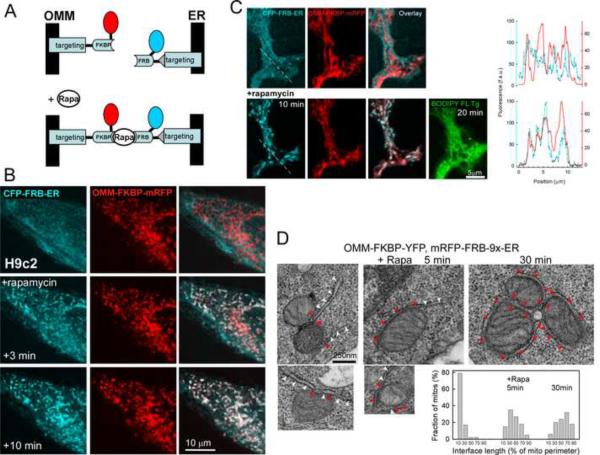
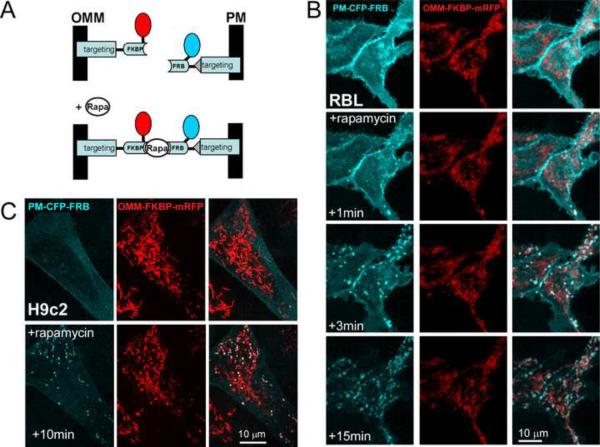
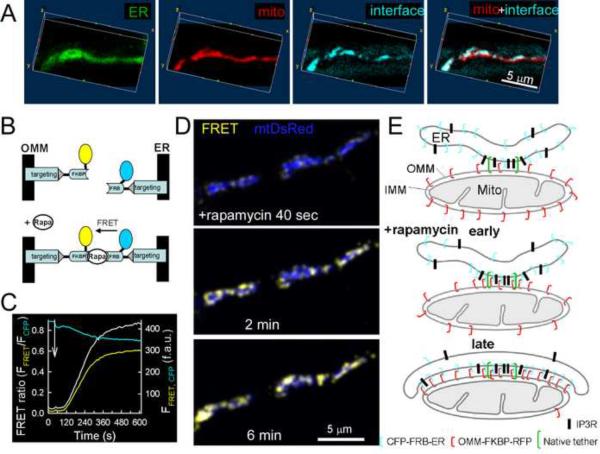
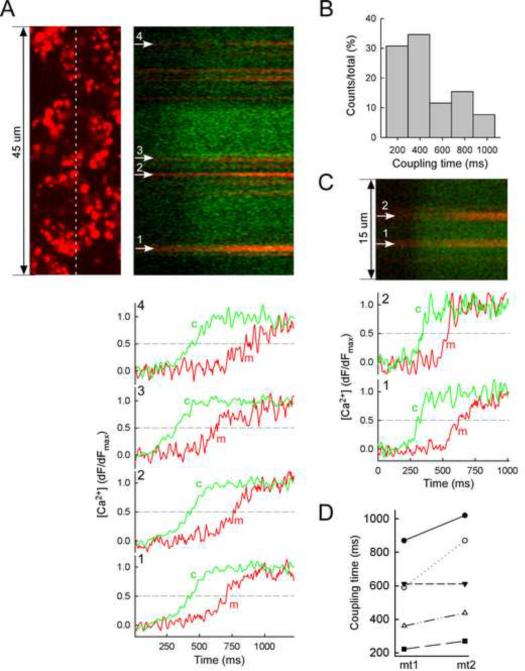
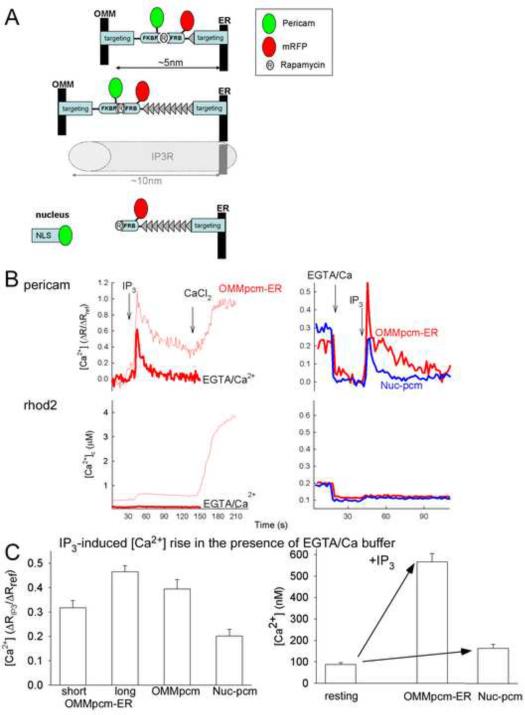
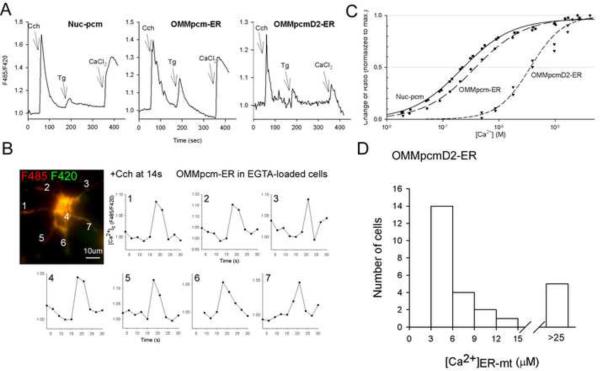
The ER-mitochondrial junction provides a local calcium signaling domain that is critical for both matching energy production with demand and the control of apoptosis. Here, we visualize ER-mitochondrial contact sites and monitor the localized [Ca(2+)] changes ([Ca(2+)](ER-mt)) using drug-inducible fluorescent interorganelle linkers. We show that all mitochondria have contacts with the ER, but plasma membrane (PM)-mitochondrial contacts are less frequent because of interleaving ER stacks in both RBL-2H3 and H9c2 cells. Single mitochondria display discrete patches of ER contacts and show heterogeneity in the ER-mitochondrial Ca(2+) transfer. Pericam-tagged linkers revealed IP(3)-induced [Ca(2+)](ER-mt) signals that exceeded 9 microM and endured buffering bulk cytoplasmic [Ca(2+)] increases. Altering linker length to modify the space available for the Ca(2+) transfer machinery had a biphasic effect on [Ca(2+)](ER-mt) signals. These studies provide direct evidence for the existence of high-Ca(2+) microdomains between the ER and mitochondria and suggest an optimal gap width for efficient Ca(2+) transfer.


Figures

Fig 1
Fig 1. Inducible tethering of the OMM to the ER
(A) Scheme illustrating the rapamycin-inducible bridge-forming modules. OMM targeting is established via the mAKAP1(34–63) presequence that is fused to an FKBP12 protein tagged with mRFP1. For ER-targeting, the C-terminal localization sequence (521–587) of the human Sac1 phosphatase is added to the C-terminus of an FRB fragment that is also tagged with CFP (Varnai and Balla, 2007). A covalent linkage between the FKBP and FRB domains is established via rapamycin that is administered to the linker-expressing cells. (B) Confocal images of an individual H9c2 cell expressing OMM-ER linker pairs show the distribution of the respective fluorophores before and after (3 and 10 min) rapamycin (100nM) treatment. Note the rapamycin-induced marked conglomeration of CFP fluorescence to the mitochondria appearing in white on the cyan/red overlay images. (C) High-resolution confocal images of a projection of an RBL-2H3 cell overexpressing CFP-labeled ER-targeted and mRFP-labeled OMM-targeted inducible linker modules. Effect of 10 min rapamycin is shown. To further illustrate the redistribution of the ER-targeted module to the mitochondria, the corresponding line profiles of the cyan and red fluorescence (along the dashed line in the first images on the left) are drawn on the right. As a reference, the ER is also visualized using BODIPY FL Tg applied ~20 min after rapamycin addition. BODIPY FL Tg was added in the end of the rapamycin time course to avoid any bleedthrough from fluorescein to the CFP channel and to avoid SERCA pump inhibition. (D) TEM imaging of RBL-2H3 cells overexpressing OMM-ER linker pairs and incubated without (left) or with rapamycin (100nM) for 5 min (middle) and 30 min (right), respectively. Images are representative of 12, 5 and 5 cells, and a total of 91, 63 and 70 mitochondria for control, 5 min and 30 min treatment conditions, respectively. Bar charts: The length of close associations (interface length) was calculated for each mitochondrion as % of the perimeter of the mitochondrial cross-section. The interface length values were binned by 20 % (x axis: 10 corresponds to 0–20%, 30 corresponds to 20–40% and so on) and their distribution is shown for each condition. For information on localization and lateral mobility of the linkers see also FigS1.
Fig 2
Fig 2. Visualization of OMM-PM associations
(A) Scheme illustrating the rapamycin-inducible OMM-PM bridge-forming modules. For PM targeting the N-terminal palmitoylation/myristoylation signal of the Lyn protein is fused to the N-terminus of the FRB. (B) Confocal images of individual RBL-2H3 cells overexpressing OMM-PM linker pairs show the distribution of the respective fluorophores before and after (1, 3 and 15 min) rapamycin (100nM) treatment. Note the rapamycin-induced marked conglomeration of CFP fluorescence to the mitochondria appearing in white on the cyan/red overlay images. (C) Confocal images of an H9c2 cell overexpressing OMM-PM linker pairs show the distribution of the respective fluorophores before and after 10 min rapamycin (100nM) treatment.
Fig 3
Fig 3. Visualization of ER-mitochondrial focal contacts using inducible linkers in processes of RBL-2H3 cells
(A) 3D reconstruction of the ER (BODIPY FL Tg, green), mitochondria (RFP-labeled OMM-targeted linker module, red) and their close interfaces (delineated by the CFP-labeled ER-targeted linker module, cyan) from a z-stack of a cell process after (~15 min) rapamycin treatment. (B) The close ER-mitochondrial contacts are depicted as the rapamycin-induced FRET increase between CFP (ER-targeted module) and YFP (OMM-targeted module). (C) Time course of CFP (cyan) and FRET fluorescence (yellow, corrected to fluorescence bleed-through from CFP and YFP) during induction of the linkage by rapamycin (addition is marked by an arrow). Traces also show the FRET ratio (FRET/CFP, white). Calculations were made for whole cell areas (n=10 experiments, 7–15 cells in each). (D) Spatial-temporal progression of the ER-OMM linkage formation followed as the change in the distribution and magnitude of FRET increase (yellow) over time. The blue image shows the mitochondrial distribution (mtDsRed, recorded simultaneously with FRET) (representative images, n=6 cells). As a background correction, approx. 5% of the maximal signal was subtracted from the images, which subtraction practically did not change the heterogeneity observed. (E) Schematics showing the progress of the rapamycin-induced ER-OMM linkage formation. In the early phase of rapamycin treatment, the ER and OMM-targeted modules are linked and retained at the ER-mitochondrial contact areas (middle). Longer incubation with rapamycin leads to expansion of the interface (lower). Putative distribution of the IP3Rs is also shown. Dependent on the linker length, narrowing of the ER-OMM gap also occurs at the area of linkage (not shown).
Fig 4
Fig 4. Millisecond resolution of the coupling between IP3-induced [Ca2+]c and [Ca2+]m signals in individual mitochondria
[Ca2+]m and [Ca2+]c were recorded in permeabilized RBL-2H3 cells as the fluorescence of the rhod2 accumulated to the mitochondria and fluo4 (10 μM) dissolved into the cytosolic buffer, respectively. Fluorescence was recorded using a confocal microscope in line-scan mode (6ms/line). (A) An xy-image of the rhod2 distribution in three neighboring cells is shown in (upper left) with the corresponding linescan recording of the rhod2 (red) and fluo4 (green) fluorescence on the right. The time courses of the IP3-induced [Ca2+]c and [Ca2+]m increases at the positions of the numbered mitochondrial spots are shown in the bottom. The traces are normalized to the maximum fluorescence increase evoked by IP3 (7.5 μM, added at 0 ms). The time courses and the line scan image share their time (x) axis. (B) The histogram shows the distribution of coupling times (difference in the halftime) recorded from 26 different mitochondrial areas from 4 independent experiments. (C) Line-scan image and time courses from two distinct mitochondrial spots in the same cell are shown. (D) Comparison of coupling times in pairs of mitochondria (<5 μm distance) from 5 different cells is shown.
Fig 5
Fig 5. Measurement of [Ca2+]ER-mt with pericam-tagged inducible linkers in permeabilized RBL-2H3 cells
(A) Constructs used to monitor [Ca2+] at the ER-OMM interface and in the nucleus: OMM-targeted linker module tagged with ratiometric pericam, while the ER-targeted module is labeled with mRFP (upper), OMM-targeted pericam with a longer version of the ER-targeted module (middle) and pericam targeted to the nuclear matrix (Nuc-pcm) combined with the longer ER-targeted module (lower). (B) Wide-field recordings of IP3-induced [Ca2+] responses detected by the differently targeted pericams. In addition, to the cell-bound pericams, [Ca2+] in the bulk cytosolic buffer was also recorded using rhod2 (bottom panels). Rapamycin (100nM) was added during cell permeabilization (7–10min) in each run. The IP3-induced rhod2 response was well below 1 μM, whereas the OMM-targeted linker pericam response peaked as high as the effect of a 20μM CaCl2 pulse that raised the [Ca2+]c to ~4μM (left, thin red lines). The bulk [Ca2+]c increase calculated from the rhod2 signal (obtained in the intercellular regions to avoid the overlap with the cellular mRFP fluorescence) is similar to the [Ca2+] rise predicted by the Winmax program (Csordas et al., 1999). When the Ca2+ buffering strength was enhanced by adding EGTA and CaCl2 (EGTA/Ca2+, 100 μM and 40 μM, respectively) the IP3-induced rhod2 response was abolished but the OMM-pcm-ER response was present (thick red lines). The traces represent the means of 20 (standard) and 8 (EGTA/Ca2+) individual cells. The panels on the right compare the IP3-induced [Ca2+] increase detected by the OMM-pcm-ER (red trace) and Nuc-pcm (blue trace) in the presence of EGTA/Ca2+-buffer. The traces represent the means of 17 and 18 individual cells. The effect of IP3 [Ca2+]pcm is normalized to the change evoked by the CaCl2 pulse (Rref, no EGTA: +20μM, EGTA/Ca2+: +60μM). The axis title shown on the left side also applies to the graphs on the right side (C) Left: The cumulated magnitudes of IP3-induced [Ca2+] increases detected by OMM-pcm-ER with the short and long ER-targeted modules, by an OMM-targeted pericam lacking rapamycin-binding domain (OMMpcm) and by Nuc-pcm and normalized to the reference Ca2+ pulse ([CaCl2] 100μM, increasing [Ca2+]c to approx. 4 μM). Right: Translation of the IP3-induced [Ca2+] rises to nM values (right). The data represent the means of 8–12 separate recordings. Effect of rapamycin on OMM-FKBP-pcm localization and ER and mitochondrial Ca2+ handling is shown in FigS2.
Fig 6
Fig 6. Measurement of IP3R-linked [Ca2+]ER-mt signal in intact cells
RBL-2H3 cells transiently overexpressing type1 muscarinic receptor and either the long version of the OMM-pcm-ER linker pair or Nuc-pcm were stimulated with saturating dose of carbachol (Cch 100 μM) in Ca2+-free extracellular buffer. In turn, SERCA inhibitor, Tg 2 μM) was added to deplete the ER Ca2+ store and thus open the store-operated Ca2+ entry channels. Three minutes later as a reference, maximum Ca2+ entry was provoked by addition of 5mM CaCl2. To avoid saturation of the Ca2+ probes, the low-affinity OMM-pcmD2-ER was also tested. Rapamycin was added for 5–6 min before the start of the run. (A) The time courses recorded with the three different probes are shown. The traces are the pericam ratios normalized to the baseline and represent the means of 3–4 parallel recordings (each collected and averaged from 3–5 cells). (B) To prevent the Cch-induced [Ca2+]c signal, EGTA/AM-loaded cells were used and the spatiotemporal pattern of the [Ca2+]ER-mt signal was visualized. The image shows the distribution of the OMM-pcm-ER fluorescence (merge of excitation at 485nm in red and 420nm in green). Time courses of the OMM-pcm-ER ratio change (normalized to the baseline) during Cch stimulation recorded at the numbered areas are shown on the graphs. (C) [Ca2+] calibration plots of Nuc-pcm, OMM-pcm-ER and OMMl-pcmD2-ER ratio as determined from experiments in permeabilized cells using stepwise Ca2+ additions. (D) The Cch-induced [Ca2+]ER-mt rise detected by OMM-pcmD2-ER translated to μMs. The histogram shows the distribution of the calculated magnitudes of [Ca2+]ER-mt responses to Cch from a total of 26 individual cells. Effect of EGTA/AM loading on the global [Ca2+] signal and the calibration of the OMM-pcm(D2)-ER ratio in terms of nM(μM) concentration is shown in FigS3.

Comment in

  • What the mitochondria see.
    Shin DM, Muallem S. Shin DM, et al. Mol Cell. 2010 Jul 9;39(1):6-7. doi: 10.1016/j.molcel.2010.06.030. Mol Cell. 2010. PMID: 20603071

References

    1. Breckenridge DG, Stojanovic M, Marcellus RC, Shore GC. Caspase cleavage product of BAP31 induces mitochondrial fission through endoplasmic reticulum calcium signals, enhancing cytochrome c release to the cytosol. J Cell Biol. 2003;160:1115–1127. - PMC - PubMed
    1. Csordas G, Hajnoczky G. Plasticity of mitochondrial calcium signaling. J Biol Chem. 2003;278:42273–42282. - PubMed
    1. Csordas G, Renken C, Varnai P, Walter L, Weaver D, Buttle KF, Balla T, Mannella CA, Hajnoczky G. Structural and functional features and significance of the physical linkage between ER and mitochondria. J Cell Biol. 2006;174:915–921. - PMC - PubMed
    1. Csordas G, Thomas AP, Hajnoczky G. Quasi-synaptic calcium signal transmission between endoplasmic reticulum and mitochondria. Embo J. 1999;18:96–108. - PMC - PubMed
    1. de Brito OM, Scorrano L. Mitofusin 2 tethers endoplasmic reticulum to mitochondria. Nature. 2008;456:605–610. - PubMed

Publication types

Substances