Comparative Study
. 2011 Jan 1;589(Pt 1):87-99.
doi: 10.1113/jphysiol.2010.190538. Epub 2010 Jul 5.

A comparison of visual responses in the lateral geniculate nucleus of alert and anaesthetized macaque monkeys

Affiliations
Comparative Study

A comparison of visual responses in the lateral geniculate nucleus of alert and anaesthetized macaque monkeys

Henry J Alitto et al. J Physiol. .

Abstract

Despite the increasing use of alert animals for studies aimed at understanding visual processing in the cerebral cortex, relatively little attention has been focused on quantifying the response properties of neurons that provide input to the cortex. Here, we examine the response properties of neurons in the lateral geniculate nucleus (LGN) of the thalamus in the alert macaque monkey and compare these responses to those in the anaesthetized animal. Compared to the anaesthetized animal, we show that magnocellular and parvocellular neurons in the alert animal respond to visual stimuli with significantly higher firing rates. This increase in responsiveness is not accompanied by a change in the shape of neuronal contrast response functions or the strength of centre–surround antagonism; however, it is accompanied by an increased ability of neurons to follow stimuli drifting at higher spatial and temporal frequencies.


Figures
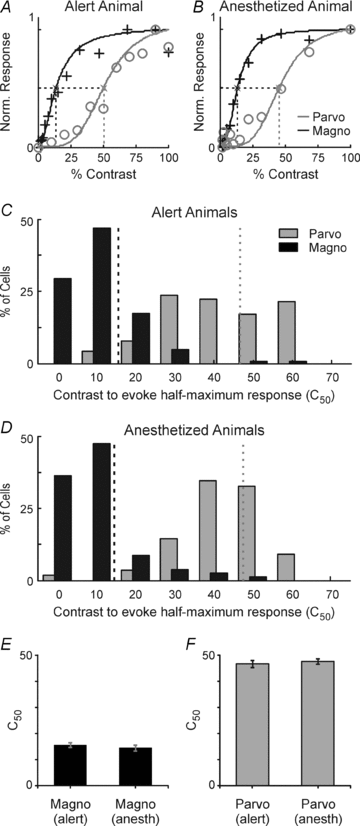
Figure 1
Figure 1. Comparison of contrast response functions from LGN neurons in alert and anaesthetized animals
A and B, contrast response functions from individual magnocellular neurons (black traces) and parvocellular neurons (grey traces) in the alert and anaesthetized animal. Data points are fitted to a hyperbolic ratio (Albrecht & Hamilton, 1982). Dashed lines indicate the contrast needed to evoke a response 50% of maximum (C50). C and D, histograms showing the distribution of C50 values for magnocellular and parvocellular neurons in alert animals and anaesthetized animals. Dashed lines indicate the means for each group of neurons. E and F, comparison of C50 values for magnocellular neurons in alert and anaesthetized animals and parvocellular neurons in alert and anaesthetized animals. C50 values did not differ significantly for magnocellular neurons or parvocellular neurons in the two conditions.
Figure 2
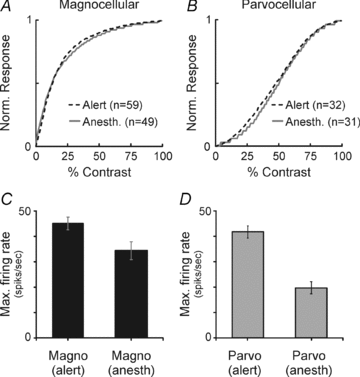
Figure 2. Normalized contrast response functions and maximum firing rates for LGN neurons in alert and anaesthetized animals
A and B, average contrast response functions for magnocellular and parvocellular neurons in alert (dashed lines) and anaesthetized animals (continuous lines). C and D, comparison of maximum-evoked responses for magnocellular and parvocellular neurons in alert and anaesthetized animals. Maximum firing rate determined from each neuron's contrast response function. Firing rates are significantly greater for magnocellular and parvocellular neurons in alert animals compared to anaesthetized animals.
Figure 3
Figure 3. Temporal frequency tuning curves and comparison of preferred temporal frequencies for LGN neurons in alert and anaesthetized animals
A and B, temporal frequency tuning curves from individual magnocellular neurons (black traces) and parvocellular neurons (grey traces) in the alert and anaesthetized animal. Data points are interpolated with a cubic spline. Dashed lines indicate each neuron's preferred temporal frequency. C and D, histograms showing the distribution of preferred temporal frequencies for magnocellular and parvocellular neurons in alert animals (n = 59 magno neurons and 49 parvo neurons) and anaesthetized animals (n = 32 magno neurons and 31 parvo neurons). Dashed lines indicate the means for each group of neurons. E and F, comparison of preferred temporal frequencies for magnocellular neurons in alert and anaesthetized animals and parvocellular neurons in alert and anaesthetized animals. Preferred temporal frequencies are significantly higher for both magnocellular and parvocellular neurons in alert animals compared to anaesthetized animals.
Figure 4
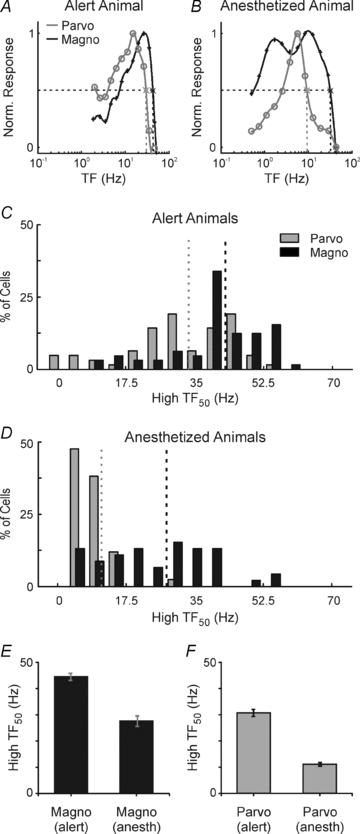
Figure 4. Comparison of high temporal frequency cutoff for LGN neurons in alert and anaesthetized animals
A and B, temporal frequency tuning curves from individual magnocellular neurons (black traces) and parvocellular neurons (grey traces) in the alert and anaesthetized animal. Data points are interpolated with a cubic spline. Dashed lines indicate the highest temporal frequency that will evoke a response 50% of maximum (TF50). C and D, histograms showing the distribution of TF50 values for magnocellular and parvocellular neurons in alert animals (n = 59 magno neurons and 49 parvo neurons) and anaesthetized animals (n = 32 magno neurons and 31 parvo neurons). Dashed lines indicate the means for each group of neurons. E and F, comparison of TF50 values from magnocellular neurons in alert and anaesthetized animals and parvocellular neurons in alert and anaesthetized animals. TF50 values are significantly higher for both magnocellular and parvocellular neurons in alert animals compared to anaesthetized animals.
Figure 5
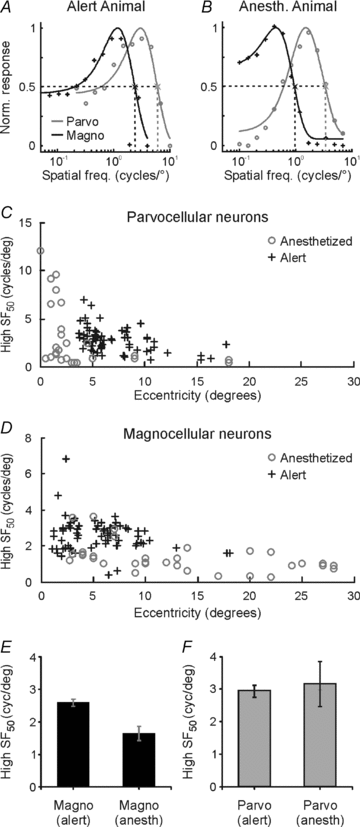
Figure 5. Comparison of high spatial frequency cutoff for LGN neurons in alert and anaesthetized animals
A and B, spatial frequency tuning curves from individual magnocellular neurons (black traces) and parvocellular neurons (grey traces) in the alert and anaesthetized animal. Data points fitted with a difference of Gaussians (DOG) equation (see Methods). Dashed lines indicate the highest spatial frequency that will evoke a response 50% of maximum (SF50). C and D, scatterplots showing the distribution of High SF50 values for magnocellular and parvocellular neurons in alert and anaesthetized animals as a function of eccentricity. E and F, comparison of SF50 values from magnocellular neurons in alert and anaesthetized animals and parvocellular neurons in alert and anaesthetized animals. SF50 values are significantly higher for magnocellular neurons in alert animals compared to anaesthetized animals. SF50 values are not significantly different for parvocellular neurons in alert and anaesthetized animals.
Figure 6
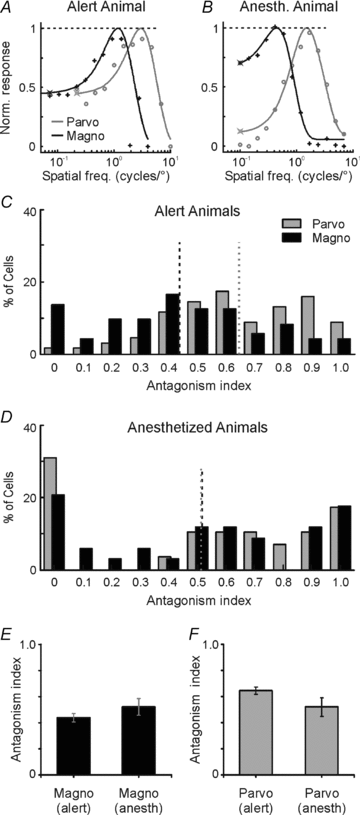
Figure 6. Surround antagonism in the LGN of alert and anaesthetized animals
A and B, spatial frequency tuning curves from individual magnocellular neurons (black traces) and parvocellular neurons (grey traces) in the alert and anaesthetized animal. Data points are fitted with a difference of Gaussians equation. Dashed lines represent responses to preferred spatial frequency; stars represent responses to lowest spatial frequency examined. C and D, histograms showing the distribution of antagonism index values (see Methods) for magnocellular and parvocellular neurons in alert animals (n = 73 magno neurons and 69 parvo neurons) and anaesthetized animals (n = 34 magno neurons and 39 parvo neurons). Dashed lines indicate the means for each group of neurons. E and F, comparison of antagonism index values from magnocellular neurons in alert and anaesthetized animals and parvocellular neurons in alert and anaesthetized animals. Index values are not significantly different for magnocellular or parvocellular neurons in alert and anaesthetized animals.
Figure 7
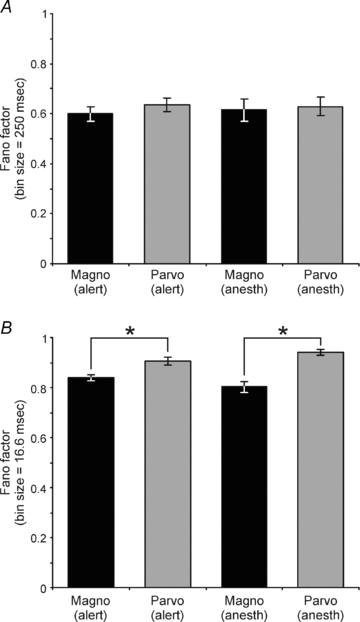
Figure 7. Response reliability in the LGN of alert and anaesthetized animals
A and B, Fano factor values (response variance/mean response) for magnocellular and parvocellular neurons in the alert and anaesthetized animal. A, mean Fano factor values for the 4 categories of LGN neurons – magnocellular and parvocellular neurons in the alert animal (0.60 ± 0.03 and 0.64 ± 0.03, respectively), and magnocellular and parvocellular neurons in the anaesthetized animal (0.61 ± 0.04 and 0.63 ± 0.04, respectively) – calculated using a bin size of 250 ms. With this bin size, there was no significant difference in the Fano factor of magnocellular and parvocellular neurons or in the Fano factor of neurons in the anaesthetized and alert animal (P = 0.54 and 0.92, respectively). B, mean Fano factor values for the 4 categories of LGN neurons – magnocellular and parvocellular neurons in the alert animal (0.84 ± 0.01 and 0.91 ± 0.02, respectively), and magnocellular and parvocellular neurons in the anaesthetized animal (0.80 ± 0.02 and 0.94 ± 0.01, respectively) – calculated using a bin size of 16.6 ms. With this bin size, there was a significant difference in the Fano factor of magnocellular and parvocellular neurons (P < 0.01), but not in the Fano factor of neurons in the alert and anaesthetized animal (P = 0.96).
Figure 8
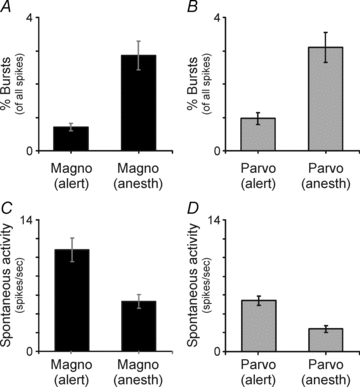
Figure 8. Burst activity and spontaneous activity in the LGN of alert and anaesthetized animals
A and B, histograms showing the percentage of spikes classified as burst spikes for magnocellular and parvocellular neurons in the alert (n = 59 magno neurons and 49 parvo neurons) and anaesthetized animal (n = 32 magno neurons and 31 parvo neurons). For magnocellular neurons in the alert and anaesthetized animal, burst spikes comprised 0.7 ± 0.1% and 2.8 ± 0.4% of all spikes, respectively (P < 0.01; ANOVA). For parvocellular neurons in the alert and anaesthetized animal, burst spikes comprised 1.0 ± 0.2% and 3.1 ± 0.5% of all spikes, respectively (P < 0.01; ANOVA). C and D, histograms showing spontaneous activity levels (spikes s−1) for magnocellular and parvocellular neurons in the alert and anaesthetized animal. For magnocellular neurons in the alert and anaesthetized animal, spontaneous activity levels were 10.8 ± 1.3 spikes s−1 and 5.3 ± 0.4 spikes s−1, respectively (P < 0.01; ANOVA). For parvocellular neurons in the alert and anaesthetized animal, spontaneous activity levels were 5.4 ± 0.5 spikes s−1 and 2.4 ± 0.4 spikes s−1, respectively (P < 0.01; ANOVA).

References

    1. Ahmad A, Spear PD. Effects of aging on the size, density, and number of rhesus monkey lateral geniculate neurons. J Comp Neurol. 1993;334:631–643. - PubMed
    1. Albrecht DG, Hamilton DB. Striate cortex of monkey and cat: contrast response function. J Neurophysiol. 1982;48:217–237. - PubMed
    1. Alitto HJ, Usrey WM. Origin and dynamics of extraclassical suppression in the lateral geniculate nucleus of the macaque monkey. Neuron. 2008;57:135–146. - PMC - PubMed
    1. Andolina IM, Jones HE, Wang W, Sillito AM. Corticothalamic feedback enhances stimulus response precision in the visual system. Proc Natl Acad Sci U S A. 2007;104:1685–1690. - PMC - PubMed
    1. Benardete EA, Kaplan E, Knight BW. Contrast gain control in the primate retina: P cells are not X-like, some M cells are. Visual Neurosci. 1992;8:483–486. - PubMed

Publication types

LinkOut - more resources