

Replacing the rod with the cone transducin subunit decreases sensitivity and accelerates response decay
- PMID: 20603337
- PMCID: PMC2976018
- DOI: 10.1113/jphysiol.2010.191221
Replacing the rod with the cone transducin subunit decreases sensitivity and accelerates response decay
Abstract
Cone vision is less sensitive than rod vision. Much of this difference can be attributed to the photoreceptors themselves, but the reason why the cones are less sensitive is still unknown. Recent recordings indicate that one important factor may be a difference in the rate of activation of cone transduction; that is, the rising phase of the cone response per bleached rhodopsin molecule (Rh*) has a smaller slope than the rising phase of the rod response per Rh*, perhaps because some step between Rh* and activation of the phosphodiesterase 6 (PDE6) effector molecule occurs with less gain. Since rods and cones have different G-protein alpha subunits, and since this subunit (Talpha) plays a key role both in the interaction of G-protein with Rh* and the activation of PDE6, we investigated the mechanism of the amplification difference by expressing cone Talpha in rod Talpha-knockout rods to produce so-called GNAT2C mice. We show that rods in GNAT2C mice have decreased sensitivity and a rate of activation half that of wild-type (WT) mouse rods. Furthermore, GNAT2C responses recover more rapidly than WT responses with kinetic parameters resembling those of native mouse cones. Our results show for the first time that part of the difference in sensitivity and response kinetics between rods and cones may be the result of a difference in the G-protein alpha subunit. They also indicate more generally that the molecular nature of G-protein alpha may play an important role in the kinetics of G-protein cascades for metabotropic receptors throughout the body.
Figures
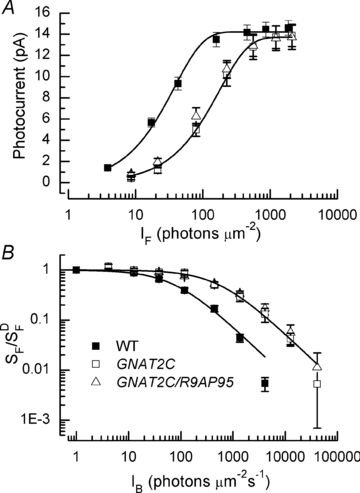
 , where r is the peak amplitude of the response to the flash, rmax is the maximum amplitude of r, I is the flash intensity, and k is a constant. Best-fitting values of k were 0.026 for WT, 0.0057 for GCAT2C and 0.0073 for GNAT2C/R9AP95. Only curves for WT and GNAT2C are shown in figure. Note that fewer rods were used for calculating the response–intensity functions than for Table 1, accounting for small differences in sensitivity and peak response amplitude. B, increment sensitivity of response to 20 ms flash in the presence of a steady background light. Sensitivity in pA photon−1μm2 was calculated in darkness (
 ) and in the presence of background light (SF) as the peak amplitude of the response in the linear range divided by the flash intensity. Ordinate gives mean sensitivity in background light divided by sensitivity in the absence of a background as a function of background intensity, averaged from 10 WT rods (filled squares), 11 GNAT2C rods (open squares), and 10 GNAT2C/R9AP95 (open triangles) rods. Continuous lines are best-fitting Weber–Fechner functions given by eqn (1) for WT rods with I0= 77 photons μm−2 s−1 and for GNAT2C rods with I0= 546 photons μm−2 s−1. A fit of the data for GNAT2C/R9AP95 rods to eqn (1) gave a best-fitting value of I0= 585 photons μm−2 s−1 (not shown).
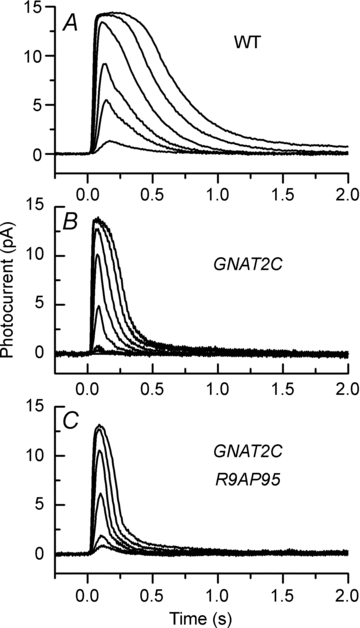
References
-
- Calvert PD, Krasnoperova NV, Lyubarsky AL, Isayama T, Nicolo M, Kosaras B, Wong G, Gannon KS, Margolskee RF, Sidman RL, Pugh EN, Jr, Makino CL, Lem J. Phototransduction in transgenic mice after targeted deletion of the rod transducin α-subunit. Proc Natl Acad Sci U S A. 2000;97:13913–13918. - PMC - PubMed
-
- Carter-Dawson LD, Lavail MM. Rods and cones in the mouse retina. I. Structural analysis using light and electron microscopy. J Comp Neurol. 1979;188:245–262. - PubMed
-
- Chen CK, Burns ME, He W, Wensel TG, Baylor DA, Simon MI. Slowed recovery of rod photoresponse in mice lacking the GTPase accelerating protein RGS9-1. Nature. 2000;403:557–560. - PubMed
Publication types
MeSH terms
Substances
Grants and funding
LinkOut - more resources
Full Text Sources
Molecular Biology Databases