. 2010 Sep 9;29(36):5032-47.
doi: 10.1038/onc.2010.250. Epub 2010 Jul 5.

ARRDC3 suppresses breast cancer progression by negatively regulating integrin beta4

Affiliations

ARRDC3 suppresses breast cancer progression by negatively regulating integrin beta4

K M Draheim et al. Oncogene. .

Abstract

Large-scale genetic analyses of human tumor samples have been used to identify novel oncogenes, tumor suppressors and prognostic factors, but the functions and molecular interactions of many individual genes have not been determined. In this study we examined the cellular effects and molecular mechanism of the arrestin family member, ARRDC3, a gene preferentially lost in a subset of breast cancers. Oncomine data revealed that the expression of ARRDC3 decreases with tumor grade, metastases and recurrences. ARRDC3 overexpression represses cancer cell proliferation, migration, invasion, growth in soft agar and in vivo tumorigenicity, whereas downregulation of ARRCD3 has the opposite effects. Mechanistic studies showed that ARRDC3 functions in a novel regulatory pathway that controls the cell surface adhesion molecule, beta-4 integrin (ITGbeta4), a protein associated with aggressive tumor behavior. Our data indicates ARRDC3 directly binds to a phosphorylated form of ITGbeta4 leading to its internalization, ubiquitination and ultimate degradation. The results identify the ARRCD3-ITGbeta4 pathway as a new therapeutic target in breast cancer and show the importance of connecting genetic arrays with mechanistic studies in the search for new treatments.


Figures

Figure 1
Figure 1
Downregulation of ARRDC3 is an early event in carcinogenesis. Oncomine was used to analyze previously published microarray data. (a) Levels of ARRDC3 mRNA are decreased in human breast cancers when compared with normal breast tissue. (b) ARRDC3 mRNA levels decrease in human mammary epithelial cells after transformation with various oncogenes. (c) Levels of ARRDC3 mRNA are decreased in metastatic lesions when compared with the primary tumor in the same patient. (d) Expression of ARRDC3 mRNA is decreased in the initial ER+ tumors from patients that have relapsed when compared with 5-year disease-free patients. All data, including P-values, were calculated from Oncomine.
Figure 2
Figure 2
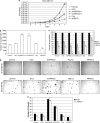
Expression of ARRDC3 affects in vitro tumorigenicity Each line was tested in triplicate and data bars represent mean±s.e.m. Single asterisk represents P<0.05, whereas a double asterisk represents P<0.001 as determined by Student's t-test. (a) Growth curves from the stable lines show that ARRDC3 overexpression suppresses cellular proliferation, whereas repression enhanced proliferation. (b) Matrigel chemo-invasion assay show that ARRDC3 overexpression suppresses invasion, whereas repression enhances invasion. (c) Wound assay of mitomycin-C treated cells shows that overexpression of ARRDC3 leads to a decrease in cell migration, whereas RNA interference-mediated repression of ARRDC3 increases cell migration. (d) ARRDC3 overexpression suppresses anchorage independent growth, whereas repression enhances anchorage independent growth. (e) Both colony number and colony size are affected. Dark gray bars represent total colonies (at least 50 μm), whereas light gray bars represent colonies larger than 200 μm.
Figure 3
Figure 3
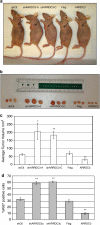
ARRDC3 negatively regulates in vivo tumorgenicity. Stable cells lines of MDA-MB-231 cells were injected into the mammary fat pads of immunocompromised mice (n=20 injections for each cell line) and grown for 7 weeks. (ab) Overexpression of ARRDC3 (ARRDC3) led to a decrease in in vivo tumor size compared with vector control (Flag), whereas repression of ARRDC3 (shARRDC3) led to an increase in tumor size compared with control (shCtl). (c) When quantified, the differences in final tumor volume were statistically significant compared with scrambled short hairpin RNA and empty vector controls. (d) ARRDC3 affects the in vivo proliferation of tumor cells as determined by percentage of Ki67-positive cells. Xenograft tumor sections were analyzed for Ki67 using IHC. Over 1500 cells per tumor were counted and scored either Ki67+ or Ki67−. In all, four to five tumor samples per group were analyzed and data bars represent mean±s.e.m. Single asterisk represents P<0.05, whereas a double asterisk represents P<0.001 as determined by Student's t-test.
Figure 4
Figure 4
ARRDC3 repression promotes in vivo cell survival. Tumors were cut in half along the longest axis therefore the center-most section of the tumor was used to make slides. Changes in necrosis are more evident when tumors of comparable size are analyzed. (a, b) Repression of ARRDC3 (shARRDC3) leads to a decrease in xenograft tumor necrosis (outlined in black) compared with control (shCtl), whereas overexpression of ARRDC3 (ARRDC3) leads to an increase in xenograft tumor necrosis compared with vector control (Flag). Dashed line represents the point where two images were merged to visualize the entire tumor section. Five tumors from each line were analyzed and the area of necrosis measured. Data bars represent mean±s.e.m. Single asterisk represents P<0.05, whereas a double asterisk represents P<0.001 as determined by Student's t-test. (c) ARRDC3 does not affect the number of apoptotic cells in xenograft tumors. Terminal deoxynucleotidyl transferase-mediated dUTP-biotin nick end labeling (TUNEL) analysis was performed on tumor sections and the number of positive cells in 10 high-powered fields ( × 40) was counted. Five tumors per group were analyzed and data bars represent mean±s.e.m. NS, not significant.
Figure 5
Figure 5
ARRDC3 negatively regulates ITGβ4. (a) Western blot analysis shows that ITGβ4 protein level is affected by ARRDC3 expression. Stable alterations of ARRDC3 expression in MDA-MB-231, MDA-MB-435 and MDA-MB-435+β4 cell lines. When ARRDC3 expression was repressed using two separate short hairpin RNA constructs (shA or shC), cells showed an increase in ITGβ4 protein when compared with control cells (Un or shCtl). Conversely, when cells were made to overexpress ARRDC3 (ARRDC3), ITGβ4 levels decreased when compared with vector control cells (Flag) or untransfected parental cells (Un). (b) Immunofluorescence shows that when MDA-MB-231 cells overexpress ARRDC3 using a green fluorescent protein (GFP)-expressing adenovirus (adARRDC3), ITGβ4 levels decrease when compared with uninfected cells (no GFP expression) and cells infected with a control GFP-expressing adenovirus (adGFP).
Figure 6
Figure 6
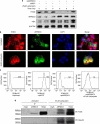
In breast cancer cells, ARRDC3 directly interacts with ubiquitinated ITGβ4 and negatively regulates protein levels in a mechanism dependent on the proteosome. (a, b) Cells can maintain high levels of ITGβ4 after ARRDC3 overexpression if treated with proteosome inhibitor Lactacystin for 6 h. (a) Western blot analysis shows that ITGβ4 levels after ARRDC3 overexpression is restored when the proteosome is inhibited. Inhibition of the proteosome is demonstrated by the accumulation of IκBα. (b) Immunofluorescence demonstrates that ITGβ4 levels are retained after ARRDC3 overexpression if cells are treated with proteosome inhibitor. Cells positive for adARRDC3 (green fluorescent protein (GFP+)) are outlined with a dashed line. (c) ARRDC3 causes a complete removal of ITGβ4 from the cell surface that is partially rescued with proteosome inhibition. The cell surface of live cells were then stained with an ITGβ4 antibody and analyzed by flow cytometry. Uninfected GFP-negative cells were gated out before ITGβ4 levels were examined. (d) Pretreatment of MDA-MB-231 cells with proteosome inhibitor lactacystin before the endogenous coimmunoprecipitation with antibodies against ARRDC3 and ITGβ4 enriches ubiquitinated forms of ITGβ4. Bands seen in the ubiquitin immunoblots were identical in size to ITGβ4 bands. Dotted line indicates noncontiguous lanes from the same film.
Figure 7
Figure 7
ARRDC3 preferentially interacts with ITGβ4 when phosphorylated on serine-1494. (a) Confocal images of a migrating MDA-MB-231 cell after wounding. Endogenous expression of ARRDC3, ITGβ4 and ITGβ4-pS1424 was detected. ARRDC3 colocalizes with ITGβ4 on the lagging edge of the cell, where ITGβ4-pS1424 is located. (b) MDA-MB-231 cells were treated with phosphatase inhibitors 1 μ sodium orthovanadate and 1 μ sodium fluoride for 3 h. Cell lysates were used in endogenous coimmunoprecipitation with antibodies against ARRDC3 and ITGβ4. ARRDC3 enriches ITGβ4-pS1424 when compared with total ITGβ4. Bands seen in the phospho-S1424 immunoblots were identical in size to ITGβ4 bands.
Figure 8
Figure 8
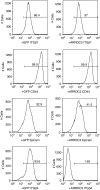
The regulation of ITGβ4 by ARRDC3 is specific and not a product of generalized increased endocytosis. MDA-MB-231 cells were infected with either a green fluorescent protein (GFP)-expressing adenovirus (+GFP) or an ARRDC3-expressing adenovirus (+ARRDC3). Nonpermeabilized cells were then analyzed by flow cytometry for various cell surface proteins. ARRDC3 overexpression did not affect surface levels of ITGβ1, CD44 or EpCam.
Figure 9
Figure 9
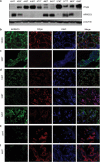
Expression of ARRDC3 in human breast tumors. (a) Western blot analysis of protein extracts from primary human breast tumors (invasive ductal carcinomas). ARRDC3 and ITGβ4 expression are inversely correlated. (bf) Immunofluorescence of primary breast or breast tumor tissue demonstrated an inverse correlation to ARRDC3 and ITGβ4 protein levels. (b) ARRDC3 is primarily expressed in the luminal cells in normal breast tissue. (c) Grade 1 breast tumors tend to express high levels of ARRDC3 and low levels of ITGβ4. (d) Grade 2 human breast tumors showed varied expression levels of ARRDC3. Expression is always the inverse of ITGβ4 expression. (e) Grade 3 breast tumors tend to express low or undetectable levels of ARRDC3 and high levels of ITGβ4. (f) Basal breast cancers with high ITGβ4 expression express very low or no levels of ARRDC3.

Similar articles

Cited by

References

    1. Adelaide J, Finetti P, Bekhouche I, Repellini L, Geneix J, Sircoulomb F, et al. Integrated profiling of basal and luminal breast cancers. Cancer Res. 2007;67:11565–11575. - PubMed
    1. Alvarez CE. On the origins of arrestin and rhodopsin. BMC Evol Biol. 2008;8:222. - PMC - PubMed
    1. Arnaout MA, Mahalingam B, Xiong JP. Integrin structure, allostery, and bidirectional signaling. Annu Rev Cell Dev Biol. 2005;21:381–410. - PubMed
    1. Aubry L, Guetta D, Klein G. The arrestin fold: variations on a theme. Curr Genomics. 2009;10:133–142. - PMC - PubMed
    1. Baril P, Gangeswaran R, Mahon PC, Caulee K, Kocher HM, Harada T, et al. Periostin promotes invasiveness and resistance of pancreatic cancer cells to hypoxia-induced cell death: role of the beta4 integrin and the PI3k pathway. Oncogene. 2007;26:2082–2094. - PubMed

Publication types

MeSH terms