

Genome-wide association filtering using a highly locus-specific transmission/disequilibrium test
- PMID: 20603721
- PMCID: PMC2921505
- DOI: 10.1007/s00439-010-0854-z
Genome-wide association filtering using a highly locus-specific transmission/disequilibrium test
Abstract
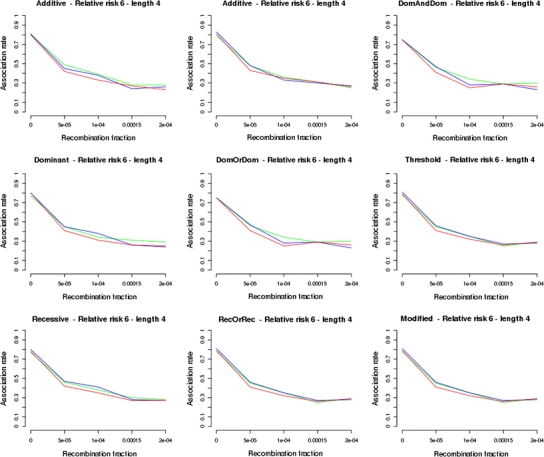
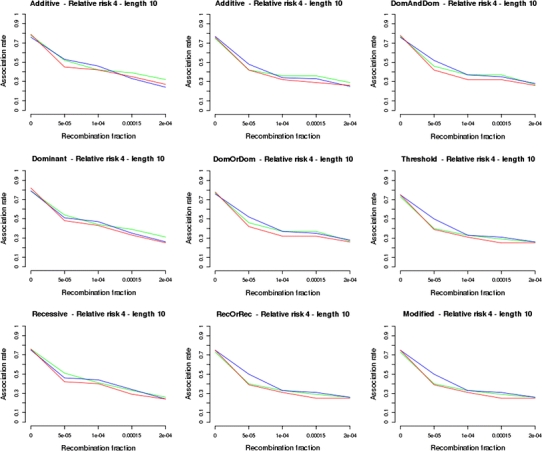
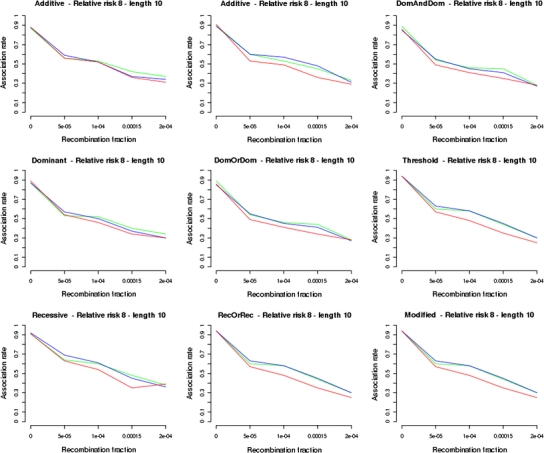
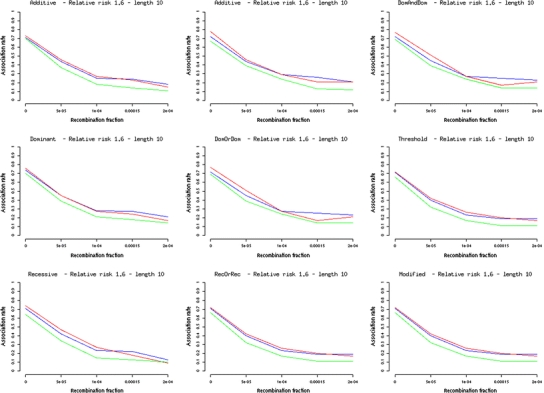
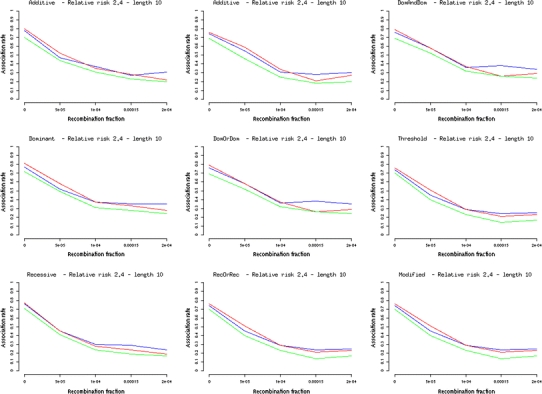
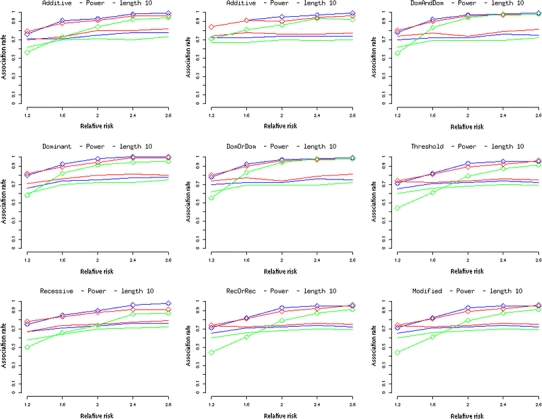
Multimarker transmission/disequilibrium tests (TDTs) are powerful association and linkage tests used to perform genome-wide filtering in the search for disease susceptibility loci. In contrast to case/control studies, they have a low rate of false positives for population stratification and admixture. However, the length of a region found in association with a disease is usually very large because of linkage disequilibrium (LD). Here, we define a multimarker proportional TDT (mTDT ( P )) designed to improve locus specificity in complex diseases that has good power compared to the most powerful multimarker TDTs. The test is a simple generalization of a multimarker TDT in which haplotype frequencies are used to weight the effect that each haplotype has on the whole measure. Two concepts underlie the features of the metric: the 'common disease, common variant' hypothesis and the decrease in LD with chromosomal distance. Because of this decrease, the frequency of haplotypes in strong LD with common disease variants decreases with increasing distance from the disease susceptibility locus. Thus, our haplotype proportional test has higher locus specificity than common multimarker TDTs that assume a uniform distribution of haplotype probabilities. Because of the common variant hypothesis, risk haplotypes at a given locus are relatively frequent and a metric that weights partial results for each haplotype by its frequency will be as powerful as the most powerful multimarker TDTs. Simulations and real data sets demonstrate that the test has good power compared with the best tests but has remarkably higher locus specificity, so that the association rate decreases at a higher rate with distance from a disease susceptibility or disease protective locus.
Figures

Similar articles
-
Sample reproducibility of genetic association using different multimarker TDTs in genome-wide association studies: characterization and a new approach.PLoS One. 2012;7(2):e29613. doi: 10.1371/journal.pone.0029613. Epub 2012 Feb 17. PLoS One. 2012. PMID: 22363405 Free PMC article.
-
Investigation of the ability of haplotype association and logistic regression to identify associated susceptibility loci.Ann Hum Genet. 2006 Nov;70(Pt 6):893-906. doi: 10.1111/j.1469-1809.2006.00301.x. Ann Hum Genet. 2006. PMID: 17044864
-
Comparison of multimarker logistic regression models, with application to a genomewide scan of schizophrenia.BMC Genet. 2010 Sep 9;11:80. doi: 10.1186/1471-2156-11-80. BMC Genet. 2010. PMID: 20828390 Free PMC article.
-
On selecting markers for association studies: patterns of linkage disequilibrium between two and three diallelic loci.Genet Epidemiol. 2003 Jan;24(1):57-67. doi: 10.1002/gepi.10217. Genet Epidemiol. 2003. PMID: 12508256 Review.
-
The extent of linkage disequilibrium and computational challenges of single nucleotide polymorphisms in genome-wide association studies.Curr Drug Metab. 2011 Jun;12(5):498-506. doi: 10.2174/138920011795495312. Curr Drug Metab. 2011. PMID: 21453276 Review.
Cited by
-
Sample reproducibility of genetic association using different multimarker TDTs in genome-wide association studies: characterization and a new approach.PLoS One. 2012;7(2):e29613. doi: 10.1371/journal.pone.0029613. Epub 2012 Feb 17. PLoS One. 2012. PMID: 22363405 Free PMC article.
References
-
- Abramowitz M, Stegun I. Handbook of mathematical functions. New York: Dover; 1972.
MeSH terms
Substances
LinkOut - more resources
Full Text Sources
Research Materials
