. 2010 Aug 3;26(15):12794-802.
doi: 10.1021/la101689z.

Cell adhesive behavior on thin polyelectrolyte multilayers: cells attempt to achieve homeostasis of its adhesion energy

Affiliations

Cell adhesive behavior on thin polyelectrolyte multilayers: cells attempt to achieve homeostasis of its adhesion energy

Sumit Mehrotra et al. Langmuir. .

Abstract

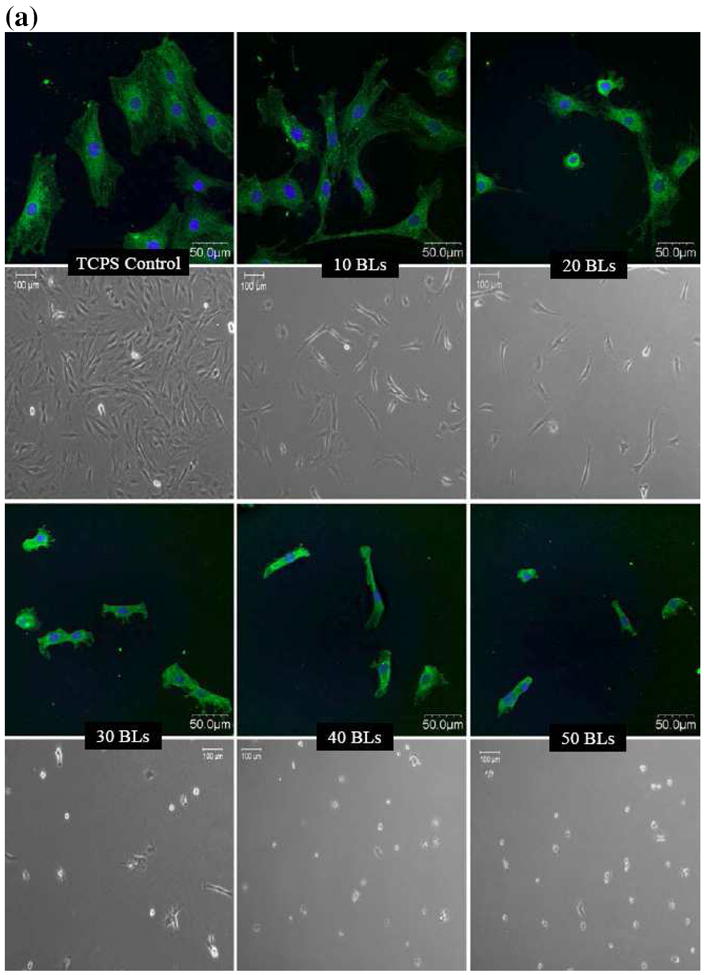
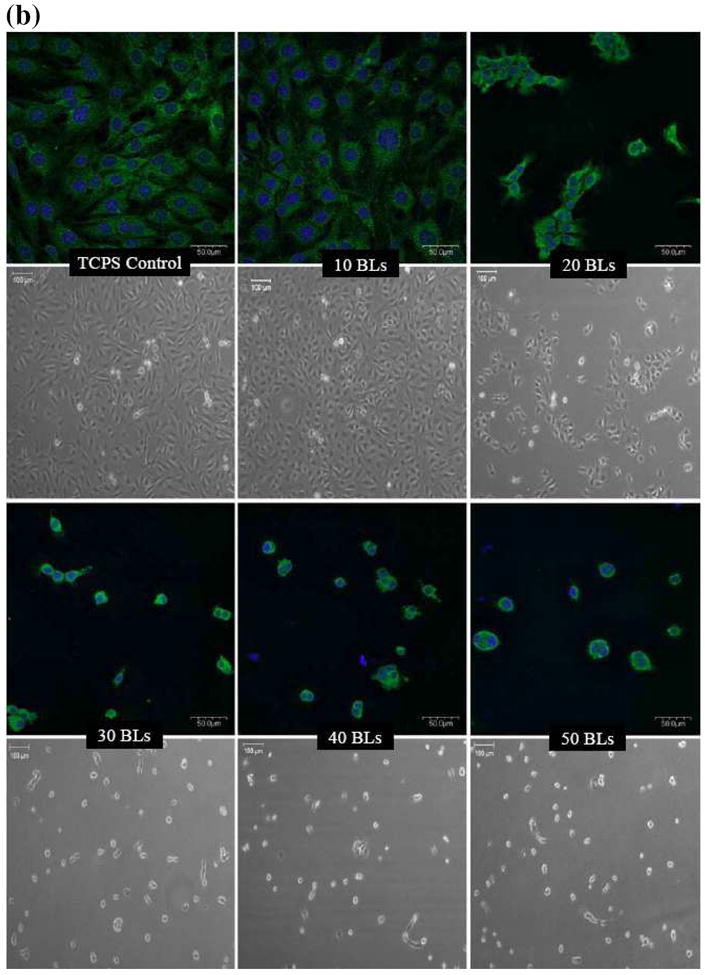
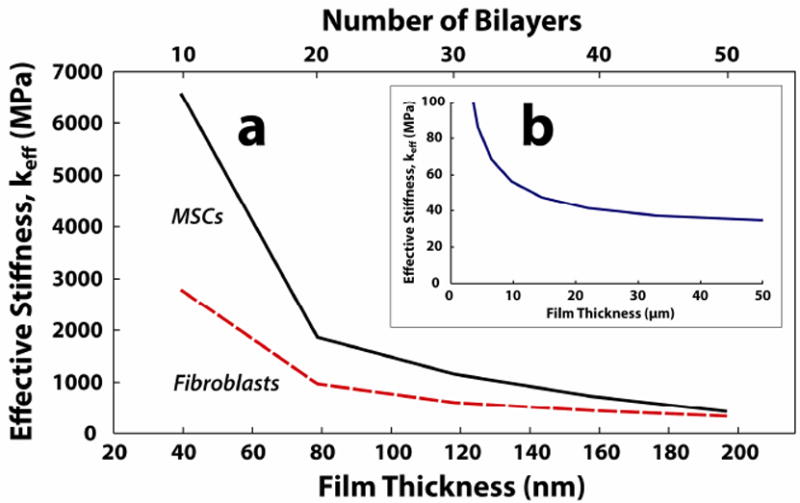
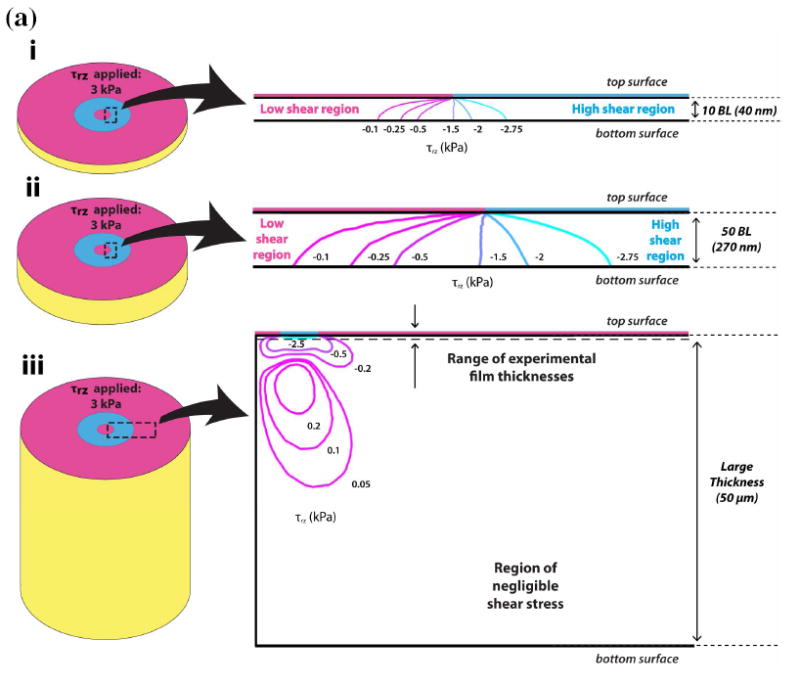
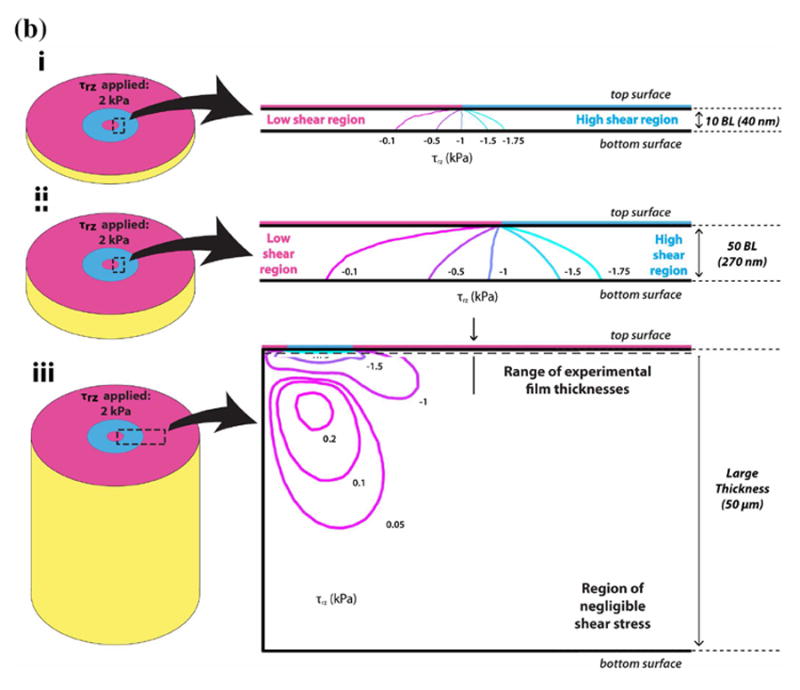
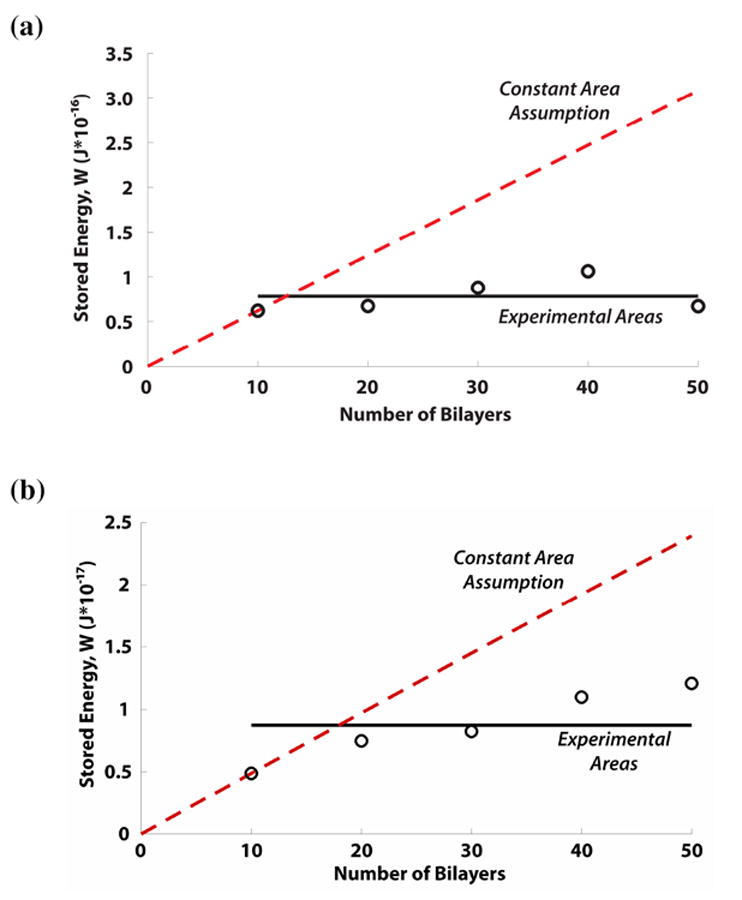
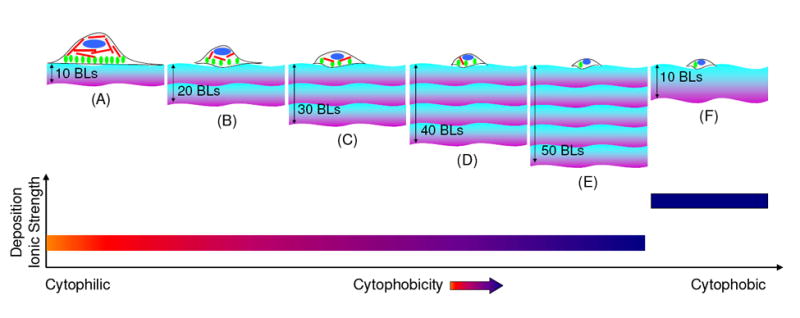
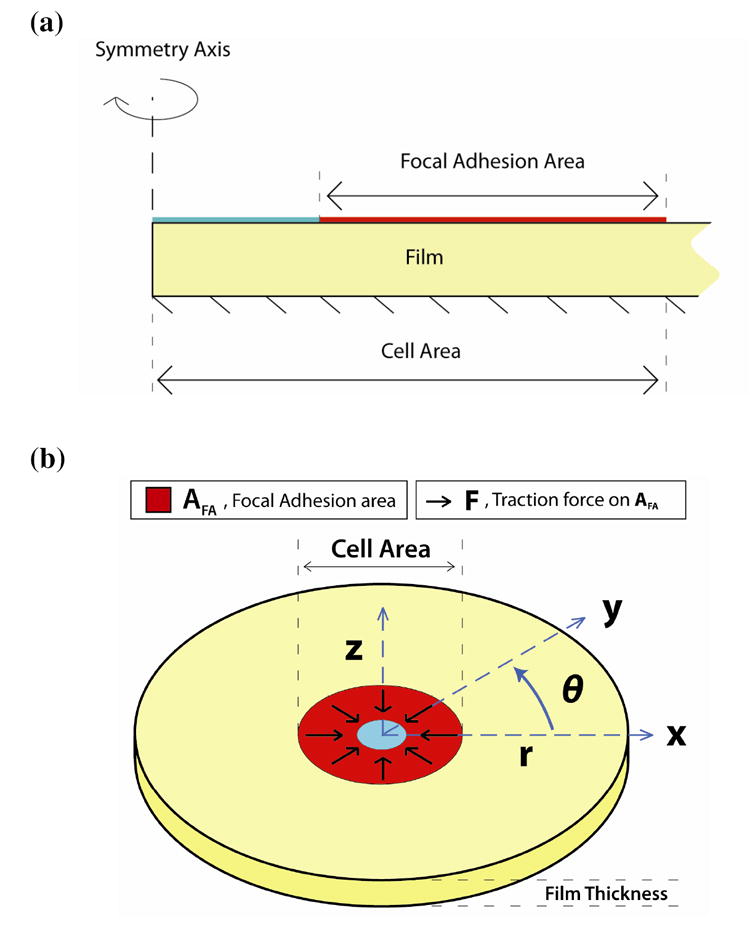
Linearly growing ultrathin polyelectrolyte multilayer (PEM) films of strong polyelectrolytes, poly(diallyldimethylammonium chloride) (PDAC), and sulfonated polystyrene, sodium salt (SPS) exhibit a gradual shift from cytophilic to cytophobic behavior, with increasing thickness for films of less than 100 nm. Previous explanations based on film hydration, swelling, and changes in the elastic modulus cannot account for the cytophobicity observed with these thin films as the number of bilayers increases. We implemented a finite element analysis to help elucidate the observed trends in cell spreading. The simulation results suggest that cells maintain a constant level of energy consumption (energy homeostasis) during active probing and thus respond to changes in the film stiffness as the film thickness increases by adjusting their morphology and the number of focal adhesions recruited and thereby their attachment to a substrate.


Figures

Figure 1
Figure 1
Confocal laser scanning and phase contrast microscopy images of (a) bone marrow mesenchymal stem cells (MCSs) and (b) NIH3T3 fibroblasts, cultured on (PDAC/SPS)n multilayers. n represents the number of PDAC/SPS bilayers (BLs), as indicated on the images. Non-coated TCPS or glass served as control surfaces. Green and blue channels show the focal adhesion sites mapped by rabbit anti-paxicillin primary antibody and Alexa Fluor 488 goat anti-rabbit IgG secondary antibody, and nuclei mapped by DAPI, respectively. CLSM images were acquired at 40X magnification, and phase contrast images were acquired at 10X magnification. Images were immunolabeled 48 hrs post cell seeding. Phase contrast images were obtained just prior to immunostaining.
Figure 1
Figure 1
Confocal laser scanning and phase contrast microscopy images of (a) bone marrow mesenchymal stem cells (MCSs) and (b) NIH3T3 fibroblasts, cultured on (PDAC/SPS)n multilayers. n represents the number of PDAC/SPS bilayers (BLs), as indicated on the images. Non-coated TCPS or glass served as control surfaces. Green and blue channels show the focal adhesion sites mapped by rabbit anti-paxicillin primary antibody and Alexa Fluor 488 goat anti-rabbit IgG secondary antibody, and nuclei mapped by DAPI, respectively. CLSM images were acquired at 40X magnification, and phase contrast images were acquired at 10X magnification. Images were immunolabeled 48 hrs post cell seeding. Phase contrast images were obtained just prior to immunostaining.
Figure 2
Figure 2
Calculated effective stiffness (keff) with respect to film thickness a) of the best-fit film thickness range for MSCs and fibroblasts, and b) of the asympototic limit (50 μm). The mean displacement varies linearly with increasing film thickness in a), thus giving an inverse relationship between the keff and film thickness.
Figure 3
Figure 3
(a, b) Shear stress contour plots for (a) MSCs and (b) fibroblasts at i) 10 BL, ii) 50 BL, and iii) very large film (50 μm) thicknesses. The large arrows indicate the close-up region of the contour plot relative to the model shown in Schematic 2b. In i), τrz is − 3 kPa and − 2 kPa at the top (focal adhesion) surfaces of the film for MSCs and fibroblasts, respectively. In both i) and ii) for MSCs and fibroblasts, the traction load penetrates the entire film, and is also borne by the underlying rigid substrate. However, in iii), the tractions from both MSCs and fibroblasts produce negligible amounts of shear stress τrz at the bottom surface of the film. In these cases, the traction load is borne solely by the film, thus the effective stiffness keff is constant for further increases in thickness.
Figure 3
Figure 3
(a, b) Shear stress contour plots for (a) MSCs and (b) fibroblasts at i) 10 BL, ii) 50 BL, and iii) very large film (50 μm) thicknesses. The large arrows indicate the close-up region of the contour plot relative to the model shown in Schematic 2b. In i), τrz is − 3 kPa and − 2 kPa at the top (focal adhesion) surfaces of the film for MSCs and fibroblasts, respectively. In both i) and ii) for MSCs and fibroblasts, the traction load penetrates the entire film, and is also borne by the underlying rigid substrate. However, in iii), the tractions from both MSCs and fibroblasts produce negligible amounts of shear stress τrz at the bottom surface of the film. In these cases, the traction load is borne solely by the film, thus the effective stiffness keff is constant for further increases in thickness.
Figure 4
Figure 4
(a) Stored energy comparison for MSCs within the experimental range of film thicknesses. Assuming no change in cell shape and morphology (red, dotted line), the stored energy increased linearly with respect to film thickness. Using the measured cell size and morphology, the stored energy remained at a nearly constant level (black, solid line with ‘o’ markers). (b). Stored energy comparison for fibroblasts within the experimental range of film thicknesses. Assuming no change in the cell shape and morphology (red, dotted line), the stored energy increased linearly with respect to film thickness. Conversely, the stored energy calculated from experimental data (black, solid line with ‘o’ markers) converges to a near constant value. The slight positive slope for the 30 – 50 bilayers for fibroblasts may be due to non-adherent clumping that resulted in a larger cell area over which the traction was exerted.
Schematic 1
Schematic 1
Diagram showing multilayers composed of linearly growing strong polyelectrolytes i.e. PDAC and SPS, fabricated at a deposition ionic strength of 0.1M NaCl, exhibit increased cytophobicity as the number of bilayers increases, as shown in images (A) to (E). Bands with violet and blue colors represents positively charged PDAC and negatively charged SPS polyelectrolyte chains, respectively; and one set of violet/purple colored band represents ten bilayers of PDAC/SPS. Red, green and blue colors inside the cell structure represent actin filaments, focal adhesion contacts and nucleus of the cell, respectively. Image (F) illustrates a previous study with a higher deposition ionic strength, the multilayers exhibit more cytophobicity due to swelling and hydration within the multilayer structure. The thickness band in image (F) represents a more loopy configuration of the polyelectrolytes with enhanced swelling and hydration within the multilayer as compared to those in images (A-E).
Schematic 2
Schematic 2
(a) Two-dimensional drawing of the axisymmetric computational domain. All forces are imposed on the boundary marked “Focal Adhesion Area”, where the bottom is fixed. In the computations, the film extends to a radius about ten-fold that of the cell area in order to eliminate edge effects (the drawing is not to scale). (b) Three-dimensional representation of the finite element model. This drawing shows the analog between the cartesian and cylindrical coordinates used in the axisymmetric model, as well as the direction of traction force over the focal adhesion area domain. The forces generated by the focal adhesion area are directed radially inward to simulate the effect of cellular probing.

Similar articles

Cited by

References

    1. Sagvolden G, Giaever I, Pettersen EO, Feder J. Proceedings of the National Academy of Sciences of the United States of America. 1999;96:471–476. - PMC - PubMed
    1. Kidambi S, Lee I, Chan C. Journal of the American Chemical Society. 2004;126:16286–16287. - PubMed
    1. Kidambi S, Udpa N, Schroeder SA, Findlan R, Lee I, Chan C. Tissue Engineering. 2007;13:2105–2117. - PMC - PubMed
    1. Mehrotra S, Lynam D, Maloney R, Pawelec KM, Tuszynski MH, Lee I, Chan C, Sakamoto J. Advanced Functional Materials. 2010;20:247–258. - PMC - PubMed
    1. Engler A, Bacakova L, Newman C, Hategan A, Griffin M, Discher D. Biophysical Journal. 2004;86:617–628. - PMC - PubMed

Publication types