Review
. 2010:26:721-44.
doi: 10.1146/annurev-cellbio-100109-104122.

A decade of systems biology

Affiliations
Review

A decade of systems biology

Han-Yu Chuang et al. Annu Rev Cell Dev Biol. 2010.

Abstract

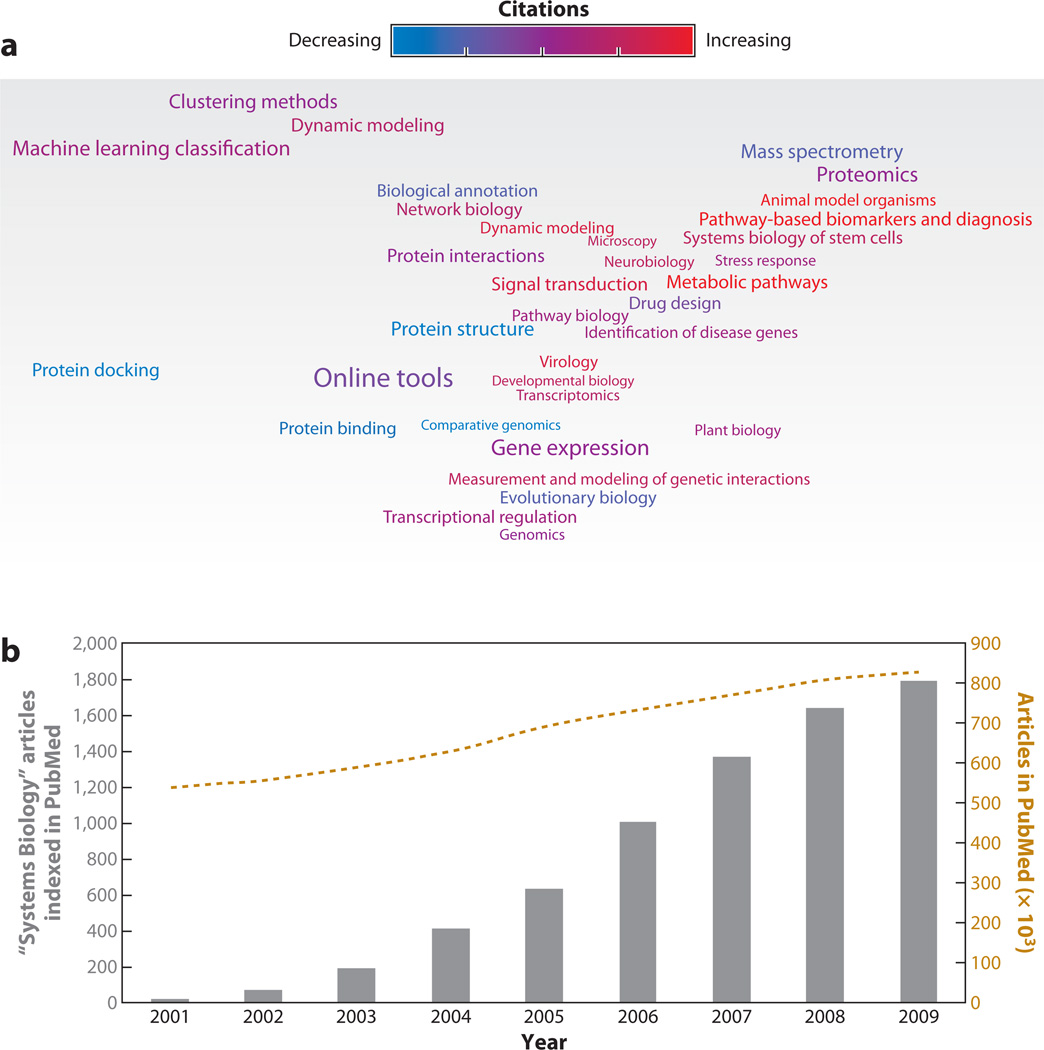
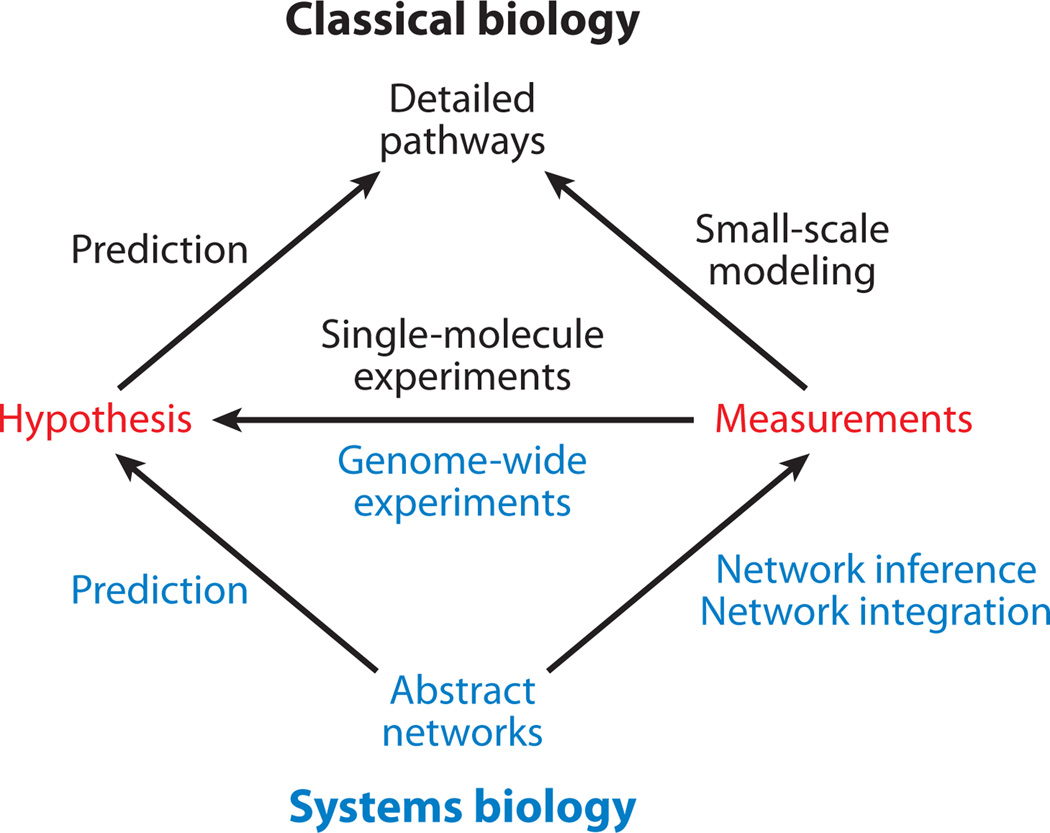
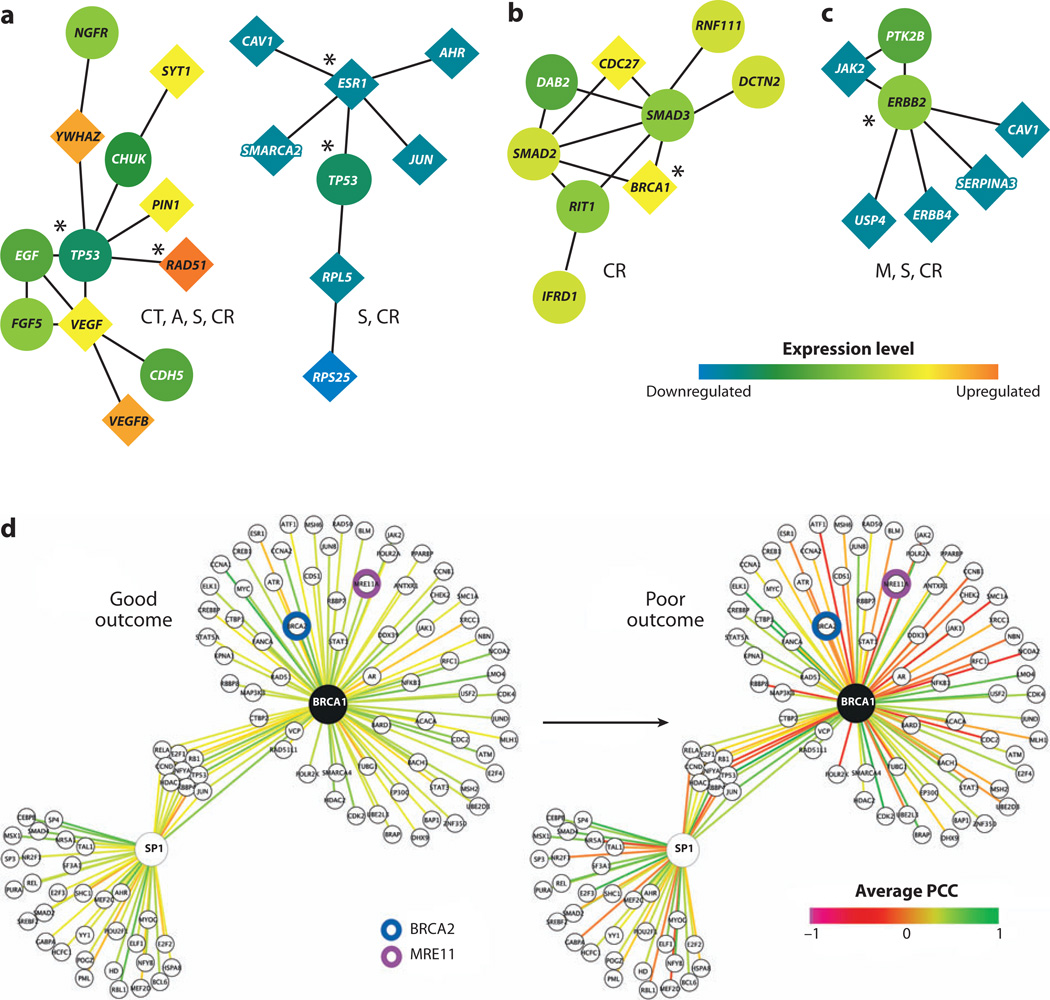
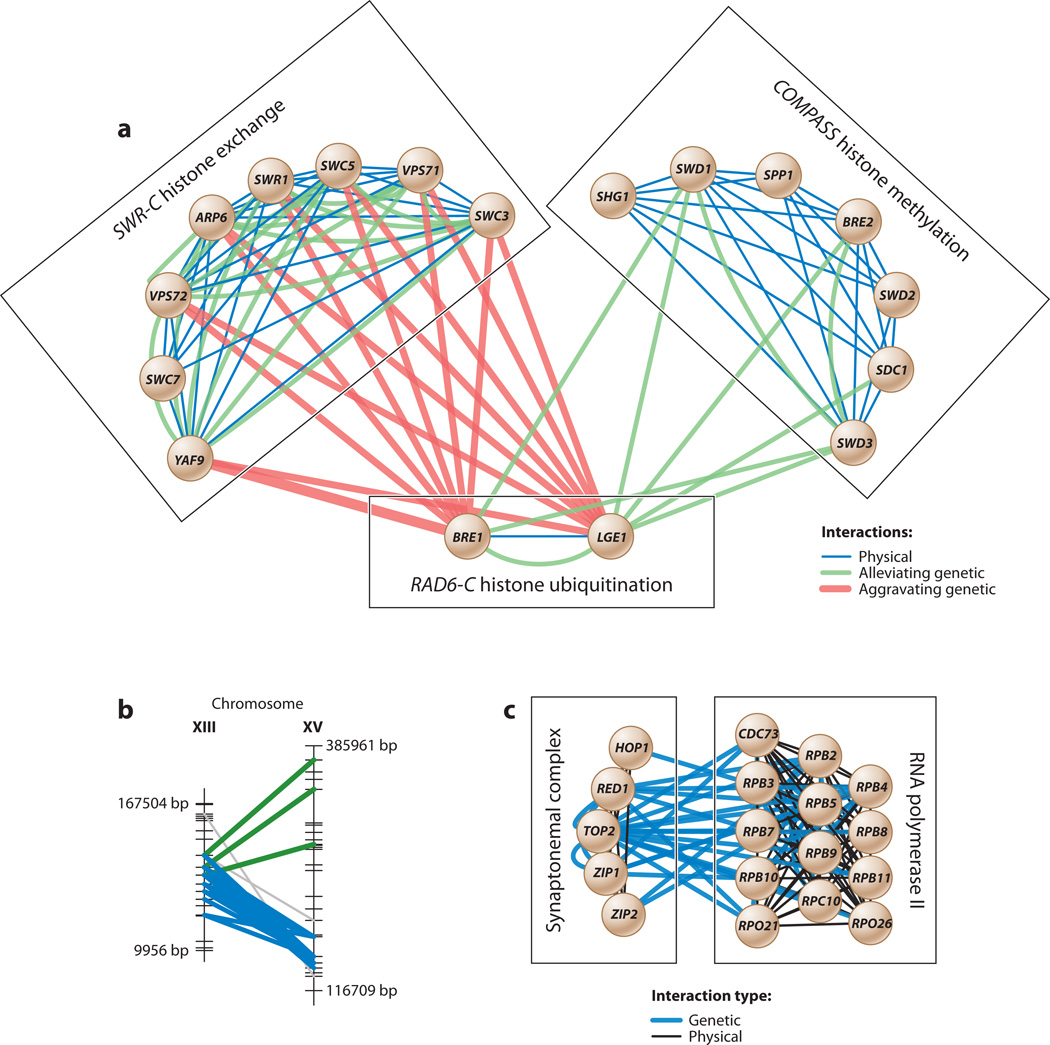
Systems biology provides a framework for assembling models of biological systems from systematic measurements. Since the field was first introduced a decade ago, considerable progress has been made in technologies for global cell measurement and in computational analyses of these data to map and model cell function. It has also greatly expanded into the translational sciences, with approaches pioneered in yeast now being applied to elucidate human development and disease. Here, we review the state of the field with a focus on four emerging applications of systems biology that are likely to be of particular importance during the decade to follow: (a) pathway-based biomarkers, (b) global genetic interaction maps, (c) systems approaches to identify disease genes, and (d) stem cell systems biology. We also cover recent advances in software tools that allow biologists to explore system-wide models and to formulate new hypotheses. The applications and methods covered in this review provide a set of prime exemplars useful to cell and developmental biologists wishing to apply systems approaches to areas of interest.


Figures

Figure 1
Figure 1
Meta-analysis of systems biology publications over the past decade. (a) A map of the 34 leading topics in systems biology during the years 2000–2009. The map represents a 2D scaling of the mutual information score between topics, i.e., closely associated topics in the map represent similar themes. The size of the text is roughly proportional to the number of papers. The color gradient indicates a change in rate of citations (from blue to purple to red). Blue indicates topics that were more common prior to 2007; red indicates topics that have been more common since 2007 (see the Supplemental Methods Section for more details on the method and topic word lists). (b) Gray bars show the number of articles indexed in PubMed per year that are labeled with the Medical Subject Heading (MeSH) “Systems Biology.” As a reference, the gold dashed line shows the number of total articles in thousands indexed in PubMed per year.
Figure 2
Figure 2
Overview of the experimental process in classical biology (top) versus systems biology (bottom).
Figure 3
Figure 3
Predictive subnetwork markers for breast cancer metastasis. (ac) Subnetworks identified by Chuang et al. (2007) involving the key susceptibility regulators (a) TP53, (b) BRCA1, or (c) ERRB2. Nodes and links represent human proteins and protein interactions, respectively. The color of each node scales with the change in expression of the corresponding gene for metastatic versus nonmetastatic cancer. The shape of each node indicates whether its gene is significantly differentially expressed (diamond) or not (circle). The predominant cellular functions are listed next to each module: M, metabolism; CT, cell and tissue remodeling; A, apoptosis; S, signaling of cell growth and survival; CR, cell proliferation and replication. Known breast cancer susceptibility genes are marked by asterisks. (d) BRCA1 and its interactors (e.g., BRCA2 and MRE11, as indicated) are highly ordered (green edges indicate correlated expression between protein pairs) in surviving patients, whereas this organization is lost in patients with aggressive cancer. In contrast, interactions involving SP1 are not significantly altered. PCC denotes the Pearson’s correlation coefficient between the expression patterns of two interacting partners. Panels (ac) are adapted with permission from Chuang et al. (2007). Panel (d) is adapted with permission from Taylor et al. (2009).
Figure 4
Figure 4
(a) Complexes associated with RAD6-C histone ubiquitination. Protein-protein interactions are enriched among the proteins within each of the three complexes; in contrast, genetic interactions are enriched both within and between complexes. Adapted with permission from Bandyopadhyay et al. (2008). COMPASS, complex of proteins associated with SET1; SWR-C, SWR1 complex; RAD6-C, RAD6 complex. (b) Interacting genomic loci (green and blue) that represent significantly dense groups of marker-marker interactions in a genome-wide association study. (c) Interacting complexes spanned by dense bundles of genetic interactions recovered from the same study. Adapted with permission from Hannum et al. (2009).
Figure 5
Figure 5
A model of mitotic regulation by Ras. (a) BI-2536, a PLK1 inhibitor, attenuates tumor growth in colorectal cancer cells (DLD-1 cell line) in vivo. Representative images of tumors after treatment are shown. (b) A model in which oncogenic Ras introduces mitotic stress that can be exacerbated to produce lethality by interfering with kinetochore and APC/C (anaphase-promoting complex) function. Genes shaded green are RSL (Regulators of Sex-Limitation) genes, whereas yellow genes cause Ras-specific lethality when overproduced. Red dashed lines illustrate genetic connections between Ras and aspects of mitotic regulation that lead to mitotic stress. Adapted with permission from Luo et al. (2009).
Figure 6
Figure 6
A systematic strategy for network reconstruction. (a) Cell state is measured using array-based mRNA expression profiles. (b) From these data, a set of putative regulators is selected. TF, transcription factor; CF, chromatin modifier factor; RNA bp, RNA-binding protein. (c) The network is perturbed with lentiviral short hairpin RNA (shRNA) against each regulator, followed by measurement of signature genes. (d) These shRNA profiling measurements are used to inform network reconstruction. Adapted with permission from Amit et al. (2009).
Figure 7
Figure 7
Core embryonic regulatory networks for cell fate decisions. (a) High-confidence protein-protein interactions between the transcription factor NANOG and NANOG-associated proteins. An iterative proteomics approach was adapted to identify proteins that physically associate with NANOG and NANOG-associated proteins by using affinity purification in conjunction with mass spectrometry (Wang et al. 2006). (b) Transcription factor binding (protein-DNA) interactions from the data generated by various recent high-throughput chromatin immunoprecipitation (ChIP) experiments. Reproduced with permission from MacArthur et al. (2009).
Figure 8
Figure 8
Graphical user interface of Cytoscape. Each window showcases a different analysis or visualization of protein interaction networks and integrated data.
Figure 9
Figure 9
Screenshot of Cell Designer when drawing a network as process diagrams.
Figure 10
Figure 10
Screenshot of Cell Designer when stimulating a network model given different input parameters.

References

    1. Adler AS, Lin M, Horlings H, Nuyten DSA, van de Vijver MJ, Chang HY. Genetic regulators of large-scale transcriptional signatures in cancer. Nat. Genet. 2006;38:421–430. - PMC - PubMed
    1. Amit I, Garber M, Chevrier N, Leite AP, Donner Y, et al. Unbiased reconstruction of a mammalian transcriptional network mediating pathogen responses. Science. 2009;326:257–263. - PMC - PubMed
    1. Anastassiou D. Computational analysis of the synergy among multiple interacting genes. Mol. Syst. Biol. 2007;3:83. - PMC - PubMed
    1. Andrianantoandro E, Basu S, Karig DK, Weiss R. Synthetic biology: new engineering rules for an emerging discipline. Mol. Syst. Biol. 2006;2 2006.0028. - PMC - PubMed
    1. Asyali MH, Colak D, Demirkaya O, Inan MS. Gene expression profile classification: a review. Curr. Bioinforma. 2006;1:55–73.

LinkOut - more resources