. 2010 Jul 6:10:13.
doi: 10.1186/1472-6793-10-13.

Morphological and molecular characterization of developing vertebral fusions using a teleost model

Affiliations

Morphological and molecular characterization of developing vertebral fusions using a teleost model

Elisabeth Ytteborg et al. BMC Physiol. .

Abstract

Background: Spinal disorders are a major cause of disability for humans and an important health problem for intensively farmed animals. Experiments have shown that vertebral deformities present a complex but comparable etiology across species. However, the underlying molecular mechanisms involved in bone deformities are still far from understood. To further explicate the mechanisms involved, we have examined the fundamental aspects of bone metabolism and pathogenesis of vertebral fusions in Atlantic salmon (Salmo salar).

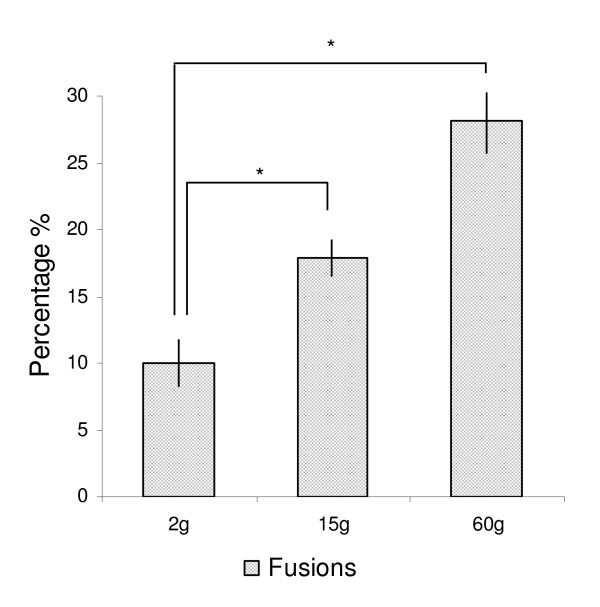
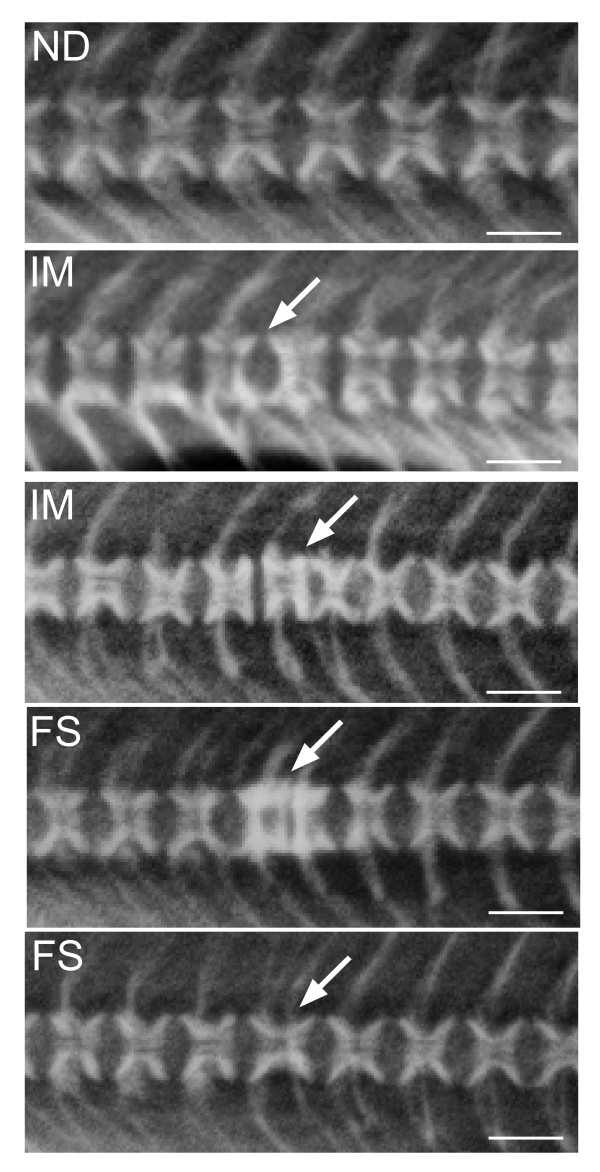
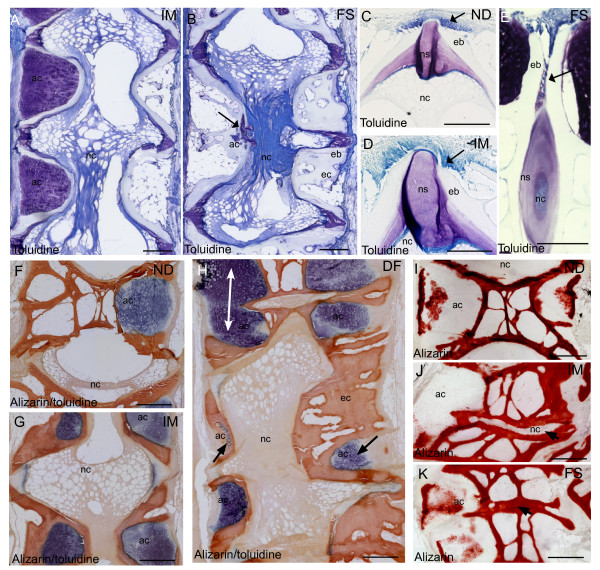
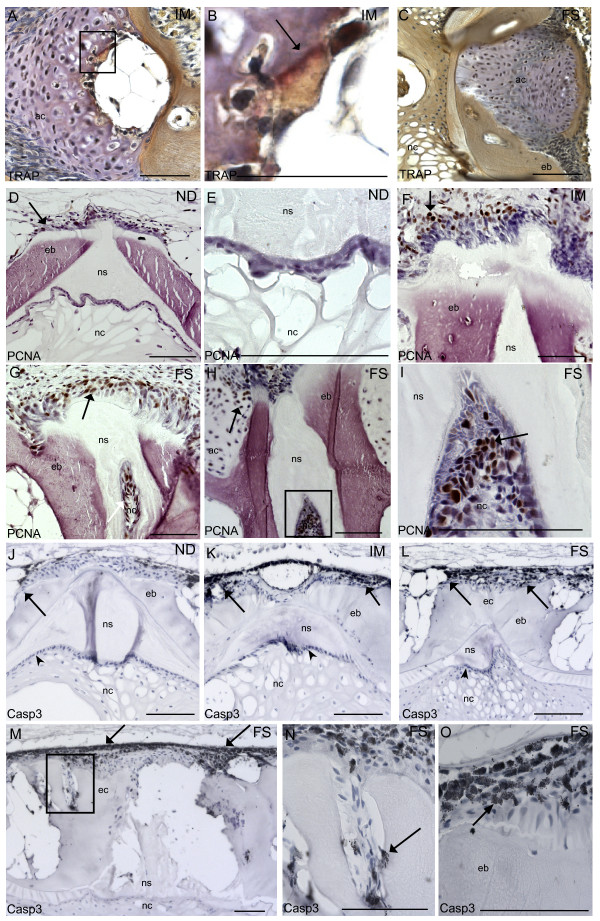
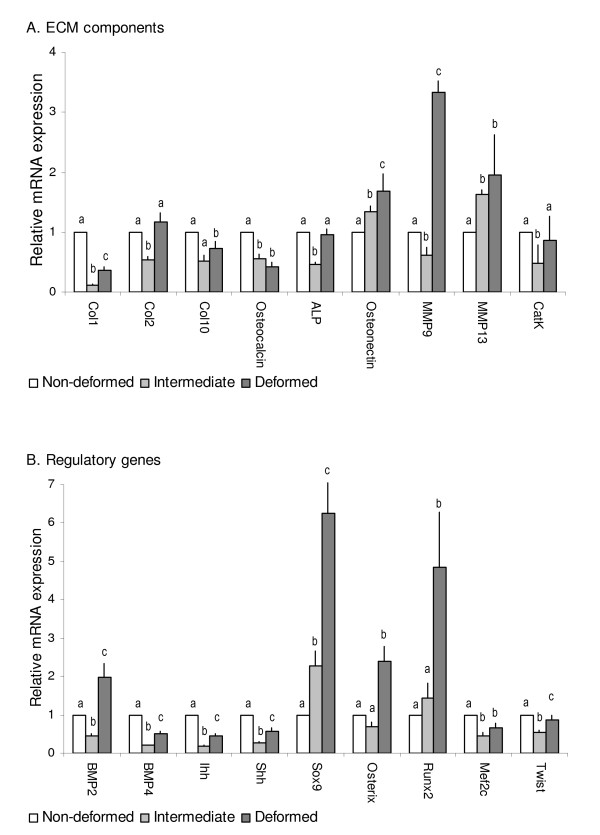
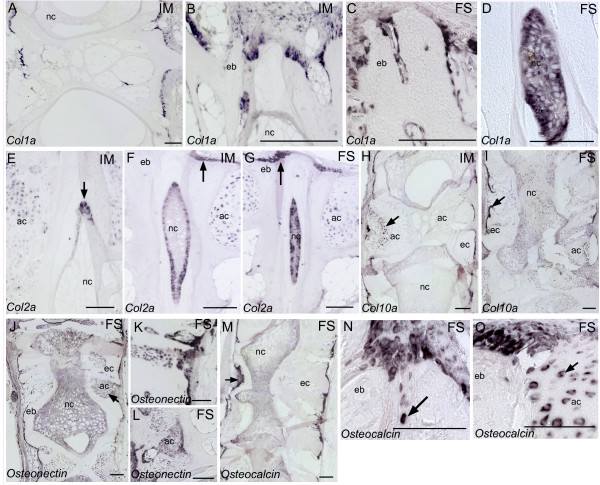
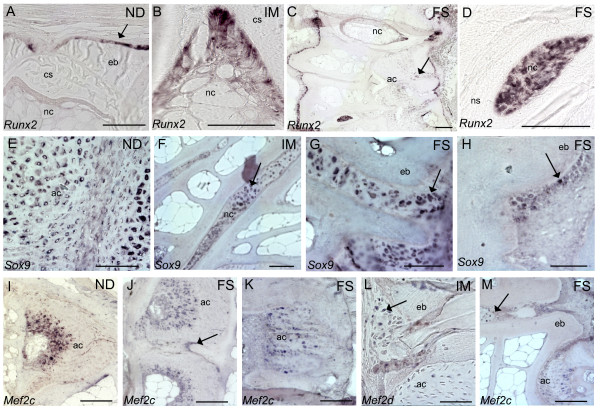
Results: Experimentally, juvenile salmon were subjected to hyperthermic conditions where more than 28% developed fused vertebral bodies. To characterize the fusion process we analyzed an intermediate and a terminal stage of the pathology by using x-ray, histology, immunohistochemistry, real-time quantitative PCR and in situ hybridization. At early stage in the fusion process, disorganized and proliferating osteoblasts were prominent at the growth zones of the vertebral body endplates. PCNA positive cells further extended along the rims of fusing vertebral bodies. During the developing pathology, the marked border between the osteoblast growth zones and the chondrocytic areas connected to the arches became less distinct, as proliferating cells and chondrocytes blended through an intermediate zone. This cell proliferation appeared to be closely linked to fusion of opposing arch centra. During the fusion process a metaplastic shift appeared in the arch centra where cells in the intermediate zone between osteoblasts and chondrocytes co-expressed mixed signals of chondrogenic and osteogenic markers. A similar shift also occurred in the notochord where proliferating chordoblasts changed transcription profile from chondrogenic to also include osteogenic marker genes. In progressed fusions, arch centra and intervertebral space mineralized.

Conclusion: Loss of cell integrity through cell proliferation and metaplastic shifts seem to be key events in the fusion process. The fusion process involves molecular regulation and cellular changes similar to those found in mammalian deformities, indicating that salmon is suitable for studying general bone development and to be a comparative model for spinal deformities.


Figures

Figure 1
Figure 1
Frequency of deformities. Spinal fusions increased at each sampling point; 2 g, 15 g and 60 g. Each bar represents the means of analysis of variance at each sampling point as registered through radiographic findings in n = 4 tanks. Data are given in percentage ± st.dev, asterix indicate significant differences (P = 0.01).
Figure 2
Figure 2
X-ray and diagnostics. The development of vertebral fusions is a dynamic process where the final result is a complete fusion of two or more vertebral bodies. Vertebrae were divided into non-deformed (ND), intermediate (IM) and fused (FS). White arrow points to malformed vertebral bodies. Scale bar = 0.1 cm.
Figure 3
Figure 3
Histological findings. Toluidine blue staining of A. Intermediate vertebrae with irregular shaped vertebral bodies and B. Fused vertebrae with ectopic bone formation and denser notochord. Remnants of the arch center are present at ventral side of the notochord (arrow). Growth zones of vertebral endplates in C. Non-deformed D. Intermediate and E. Fused vertebrae. Osteoblasts appeared more disorganized throughout the pathology (arrow). At fused stage, osteoblasts located abaxial between vertebral bodies were observed. Double staining with Alizarin red S and toluidine blue of F. Non-deformed, G. Intermediate and H. Deformed vertebrae. Ectopic bone formation and reduced (arrow) or fused (white double arrow) arch centra was prominent throughout the developing pathology. Alizarin red S staining of I. Non-deformed J. Intermediate and K. Fused vertebrae. Notochordal tissue did not stain with alizarin red S until fusion was complete (arrow). ND, non-deformed; IM, intermediated; FS, fused, nc, notochord; ns, notochordal sheath, eb, endbone; ec, ectopic bone. Scale bar = 100 μm.
Figure 4
Figure 4
Immunohistochemistry with TRAP, PCNA and Caspase 3. A: One sample from intermediate group showed weak positive TRAP staining (arrow) at the ossifying border of the hypertrophic chondrocytes. B. Higher magnification of black box in A, positive TRAP staining (arrow). C. No TRAP activity was detected in any of the samples from the fused group. PCNA positive cells (brown) in D. Non-deformed. Some proliferating cells can be seen at the growth zones of the vertebral body endplate (arrow). E. Higher magnification of chordoblasts in non-deformed. Positive cells were rarely found in chordoblasts. F. Intermediate vertebrae. PCNA was detected in higher amount at growth zones of the vertebral body endplate and extending abaxial and axial direction (arrow). G. Fused vertebrae. PCNA labeled cells were detected in the corresponding areas, but in higher abundance (arrow). H. PCNA positive cells were observed in the notochord and also in arch centra (arrow). I. Higher magnification of the black box in H, PCNA positive notochordal cells (arrow). Caspase 3 positive cells (black) in J. Non-deformed. Caspase 3 positive cells can be seen at the fringe of the growth zones of the vertebral body endplate (arrow). No positive cells could be detected in the chordoblasts (arrowhead) in any of the groups. K. Intermediate vertebrae; positive cells were detected in exceedingly higher amount at the corresponding areas (arrows). L. Fused vertebrae; positive cells were detected in the corresponding areas, but in higher amounts (arrow). M. Positive caspase 3 signal increased along the rims of the vertebral body and in trabeculae in fused vertebral bodies where we observed ectopic bone formation (arrow). N. Higher magnification of black box in E showing caspase 3 positive cells in the joints of ectopic bone (arrow). O. Higher magnification of caspase 3 labeled cells showing typical apoptotic phenotype with membrane blebbing (arrow). ND, non-deformed; IM, intermediated; FS, fused, nc, notochord; ns, notochordal sheath, eb, endbone; ec, ectopic bone. Scale bar = 100 μm.
Figure 5
Figure 5
Quantitative gene transcription profiles in intermediate and fused vertebral bodies. Relative gene transcription of A. Extracellular matrix constituents and B. Regulatory genes in non-deformed (white bars) intermediate (light grey bars) and fused (dark grey bars) vertebrae, normalized with ef1a. Significant values (P = 0.05) indicated by a-b-c, n = 15, means ± SE. Transcription ratios are shown in relative mRNA expression along the y-axis, genes along the x-axis.
Figure 6
Figure 6
In situ hybridization of genes involved in the extracellular matrix. A. Col1a transcription observed in trabeculae and at the growth zones of vertebral body endplates of intermediate vertebrae. B. Col1a in osteoblasts extending from the growth zones of the vertebral body endplate in intermediate and C. fused vertebrae. D. Col1a transcription in the notochord of a fusion. E. Col2a transcription in chordoblasts of intermediate vertebrae (arrow). F. Col2a transcription increased as intervertebral space narrowed down. In addition, col2a was observed at the osteoblast growth zone at the vertebral body endplates (arrow). G. In fused vertebrae, most cells in intervertebral space expressed col2a and expression in the osteoblasts increased (arrow). H. Col10a transcription along the rims of intermediate vertebrae and in hypertrophic chondrocytes (arrow). I. Col10a was more expressed in areas with ectopic bone formation (arrow). J. Osteonectin in fused vertebral bodies. Notice transcription along the rims of the vertebral bodies as well as in chondrocytes (arrow). Stronger staining was observed in areas with ectopic bone formation. K. Osteonectin transcription in areas with ectopic bone formation. L. Osteonectin transcribing chondrocytes. M. Osteocalcin was expressed in chondrocytes and along the rims of fused vertebrae. N. Osteocalcin transcription at the growth zone of two vertebral body endplates in a fusion. Notice cells expressing osteocalcin abaxial in-between the vertebral bodies (arrow). O. Osteocalcin expressing cells blending with chondrocytes. Both osteoblasts and chondrocytes expressed osteocalcin in these areas. ND, non-deformed; IM, intermediated; FS, fused, nc, notochord; ns, notochordal sheath, eb, endbone; ec, ectopic bone. Scale bar = 100 μm.
Figure 7
Figure 7
In situ hybridization of genes involved in regulatory processes. A. Runx2 at the osteoblast growth zone of the vertebral body endplates in non-deformed vertebral bodies (arrow). Notice no transcription in chordocytes. B. Runx2 transcription in intermediate vertebrae showed transcription in chordoblasts. C. Runx2 transcription in fused vertebrae, notice positive staining in the chordocytes and in areas with ectopic bone formation (arrow). D. Strong staining of runx2 in cells in the notochord of a fusion. E. Sox9 transcription chondrocytes of non-deformed vertebrae. F. Fused vertebrae had high sox9 transcription in intervertebral space. G. Higher magnification of cells expressing sox9 at the vertebral growth zone of a fusion. H. Sox9 was also expressed along the rims of ectopic bone formation. I. Mef2c transcription in hypertrophic zone in non-deformed vertebral bodies. J. Mef2c in fusing arch centra. Notice positive cells outside the hypertrophic zone (arrow). K. Mef2c in arch center narrowing down. L. Mef2c transcription at the growth zones blending with the arch centra. M. Mef2c positive cells in intervertebral space of an incomplete fusion (arrow). ND, non-deformed; IM, intermediated; FS, fused, nc, notochord; ns, notochordal sheath, eb, endbone; ec, ectopic bone. Scale bar = 100 μm.

References

    1. Lotz JC. Animal models of intervertebral disc degeneration - Lessons learned. Spine. 2004;29:2742–2750. doi: 10.1097/01.brs.0000146498.04628.f9. - DOI - PubMed
    1. Renn J, Winkler C, Schartl M, Fischer R, Goerlich R. Zebralish and medaka as models for bone research including implications regarding space-related issues. Protoplasma. 2006;229:209–214. doi: 10.1007/s00709-006-0215-x. - DOI - PubMed
    1. Suzuki H, Takahashi K, Yamagata M, Shimizu S, Moriya H, Yamazaki M. Spatial and temporal collagen gene expression in lumbar intertransverse fusion in the rabbit. Journal of Bone and Joint Surgery-British Volume. 2001;83B:760–766. doi: 10.1302/0301-620X.83B5.10792. - DOI - PubMed
    1. Urban JPG, Roberts S. Degeneration of the intervertebral disc. Arthritis Research & Therapy. 2003;5:120–130. doi: 10.1186/ar629. - DOI - PMC - PubMed
    1. Roberts S, Evans H, Trivedi J, Menage J. Histology and pathology of the human intervertebral disc. Journal of Bone and Joint Surgery-American Volume. 2006;88A:10–14. doi: 10.2106/JBJS.F.00019. - DOI - PubMed

Publication types

LinkOut - more resources