Randomized Controlled Trial
. 2010 Jul;32(3):348-53.
doi: 10.1016/j.gaitpost.2010.06.004.

Re-interpreting detrended fluctuation analyses of stride-to-stride variability in human walking

Affiliations
Randomized Controlled Trial

Re-interpreting detrended fluctuation analyses of stride-to-stride variability in human walking

Jonathan B Dingwell et al. Gait Posture. 2010 Jul.

Abstract

Detrended fluctuation analyses (DFA) have been widely used to quantify stride-to-stride temporal correlations in human walking. However, significant questions remain about how to properly interpret these statistical properties physiologically. Here, we propose a simpler and more parsimonious interpretation than previously suggested. Seventeen young healthy adults walked on a motorized treadmill at each of 5 speeds. Time series of consecutive stride lengths (SL) and stride times (ST) were recorded. Time series of stride speeds were computed as SS=SL/ST. SL and ST exhibited strong statistical persistence (α≫0.5). However, SS consistently exhibited slightly anti-persistent (α<0.5) dynamics. We created three surrogate data sets to directly test specific hypotheses about possible control processes that might have generated these time series. Subjects did not choose consecutive SL and ST according to either independently uncorrelated or statistically independent auto-regressive moving-average (ARMA) processes. However, cross-correlated surrogates, which preserved both the auto-correlation and cross-correlation properties of the original SL and ST time series successfully replicated the means, standard deviations, and (within computational limits) DFA α exponents of all relevant gait variables. These results suggested that subjects controlled their movements according to a two-dimensional ARMA process that specifically sought to minimize stride-to-stride variations in walking speed (SS). This interpretation fully agrees with experimental findings and also with the basic definitions of statistical persistence and anti-persistence. Our findings emphasize the necessity of interpreting DFA α exponents within the context of the control processes involved and the inherent biomechanical and neuro-motor redundancies available.


Conflict of interest statement

CONFLICT OF INTEREST

The authors declare they have no conflicts of interest.

Figures

Figure 1
Figure 1
A: Typical example of the stride length (SL), stride time (ST), and stride speed (SS) time series obtained from a representative subject for a trial where the subject walked at their preferred walking speed (PWS). Both the SL and ST time series exhibited periods where values continued increasing or decreasing across multiple consecutive strides. However, these patterns were not observed in the SS time series (obtained as SS = SL/ST). Qualitatively similar results were observed in all subjects. B: DFA exponents (α) obtained from all stride length (SL), stride time (ST), and stride speed (SS) time series as a function of walking speed from 80% to 120% of preferred walking speed (PWS). Error bars indicate between-subject ±95% confidence intervals. Subjects exhibited significant stride-to-stride statistical persistence (i.e., α ≫ ½) in both SL and ST, suggesting that deviations in these measures were not immediately corrected on consecutive strides. Conversely, subjects consistently exhibited slight anti-persistence (i.e., α < ½) in stride speeds (SS), suggesting that this measure of walking performance was under tighter control.
Figure 2
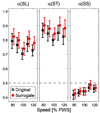
Figure 2. Randomly Shuffled Surrogates
Randomly shuffled surrogates were generated for both the SL and ST time series. The surrogate SS time series were then computed as SS = SL/ST. By construction, these surrogates exhibited the same means and standard deviations (not shown) as the original walking data. This figure shows the average DFA exponents (α) obtained from all original and surrogate SL, ST, and SS time series as a function of walking speed. Error bars represent between-subject ±95% confidence intervals. The vertical scale is the same as in Fig. 1B. However, the Original and Surrogate data points were shifted slightly to the left or right, respectively, to improve the clarity of the figure. Unlike the experimental trials, these shuffled surrogates exhibited no strong temporal correlations (all α ≈ ½) for any of the three variables. Note that the error bars on the surrogate data points are very small.
Figure 3
Figure 3. Phase-Randomized Surrogates
Phase-randomized surrogates were generated separately for the SL and ST time series. The surrogate SS time series were then computed as SS = SL/ST. By construction, these surrogates exhibited nearly the same means and standard deviations (not shown) as the original walking data. This figure shows average DFA exponents (α) obtained from all original and surrogate SL, ST, and SS time series as a function of walking speed. Error bars represent between-subject ±95% confidence intervals. The vertical scale is the same as in Fig. 1B. Original and Surrogate data points were again shifted slightly to the left or right, respectively, to improve clarity. By construction, these surrogates exhibited nearly the same α for SL and ST as experimental trials. However, unlike experimental trials, the surrogate SS time series exhibited strong statistical persistence (i.e., α ≫ ½).
Figure 4
Figure 4. Cross-Correlated Surrogates
Cross-correlated surrogates were generated jointly for both the SL and ST time series. The surrogate SS time series were then computed as SS = SL/ST. By construction, these surrogates exhibited nearly the same means and standard deviations (not shown) as the original walking data. This figure shows average DFA exponents (α) obtained from all original and surrogate SL, ST, and SS time series as a function of walking speed. Error bars represent between-subject ±95% confidence intervals. The vertical scale is the same as in Fig. 1B. Original and Surrogate data points were again shifted slightly to the left or right, respectively, to improve clarity. By construction, these surrogates exhibited nearly the same α for SL and ST as the experimental trials. However, unlike the independently phase-randomized surrogates (Fig. 3), the surrogate SS time series now exhibited nearly the same statistical anti-persistence (i.e., α < ½) as humans (p = 0.284).
Figure 5
Figure 5. Maximum Distances Walked
Histograms of the maximum absolute distances “walked” by all surrogates, and by humans, at all walking speeds. Zero (0) represents the center of the treadmill and the maximum absolute distance to either the front or back edge of the treadmill was 0.86 m. A) The vast majority of the randomly shuffled surrogates remained well within the treadmill limits. B) The phase-randomized surrogates exhibited the greatest tendency to “wander” along the treadmill, greatly increasing the distances walked. C) The cross-correlated surrogates remained closest to the center of the treadmill (0) in spite of retaining the same statistical persistence in both SL and ST as the phase-randomized surrogates. D) The distribution of distances walked by human subjects was most closely matched by that of the cross-correlated surrogates (C). Note that the vertical scale in (D) is very different because 20 surrogate trials were generated for every 1 trial of human walking.

References

    1. Jordan K, Challis JH, Cusumano JP, Newell KM. Stability and the time-dependent structure of gait variability in walking and running. Hum. Mov. Sci. 2009;28(1):113–128. - PubMed
    1. Delignières D, Torre K. Fractal dynamics of human gait: A reassessment of the 1996 data of hausdorff et al. J. Appl. Physiol. 2009;106(4):1272–1279. - PubMed
    1. Hausdorff JM. Gait dynamics, fractals and falls: Finding meaning in the stride-to-stride fluctuations of human walking. Hum. Mov. Sci. 2007;26(4):555–589. - PMC - PubMed
    1. Terrier P, Turner V, Schutz Y. Gps analysis of human locomotion: Further evidence for long-range correlations in stride-to-stride fluctuations of gait parameters. Hum. Mov. Sci. 2005;24(1):97–115. - PubMed
    1. Hausdorff JM, Schaafsma JD, Balash Y, Bartels AL, Gurevich T, Giladi N. Impaired regulation of stride variability in parkinson's disease subjects with freezing of gait. Exp. Brain Res. 2003;149(2):187–194. - PubMed

Publication types