. 2010 Sep 17;285(38):29295-304.
doi: 10.1074/jbc.M110.108423. Epub 2010 Jul 6.

Dominant negative effects of a non-conducting TREK1 splice variant expressed in brain

Affiliations

Dominant negative effects of a non-conducting TREK1 splice variant expressed in brain

Emma L Veale et al. J Biol Chem. .

Abstract

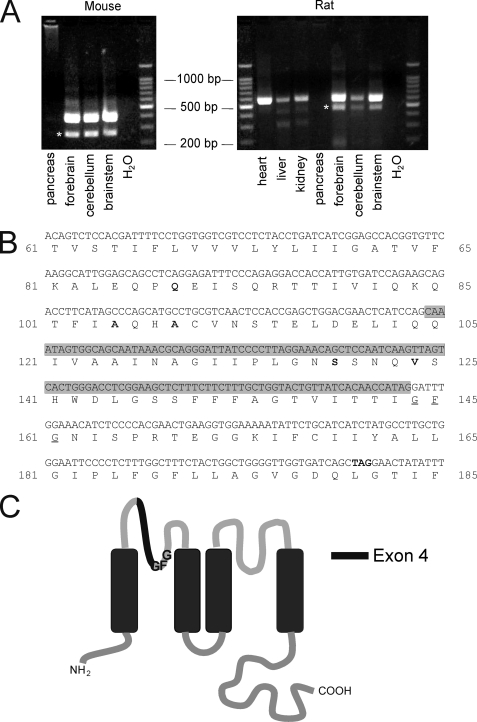
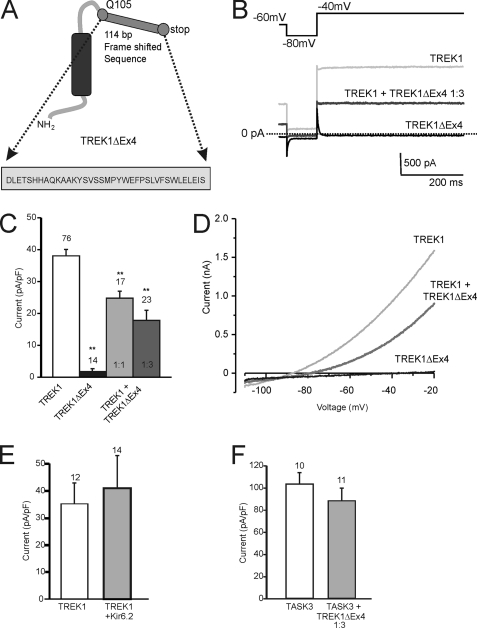
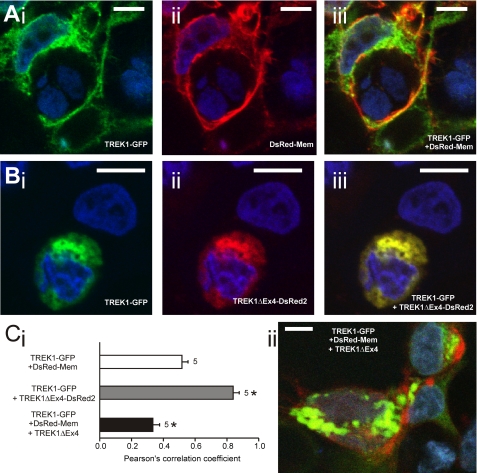
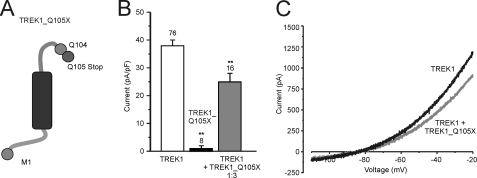
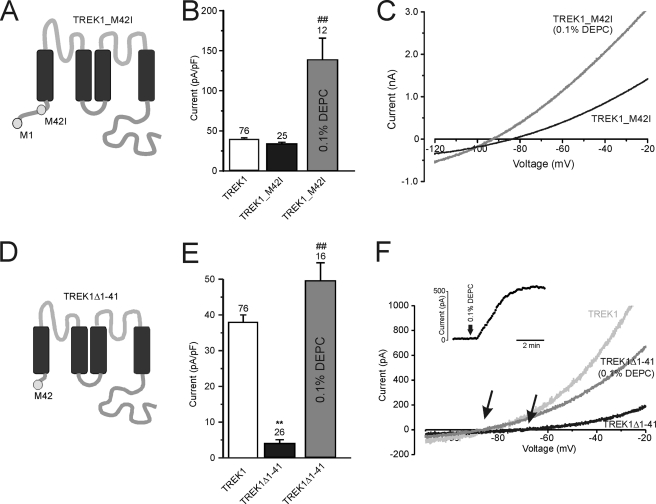
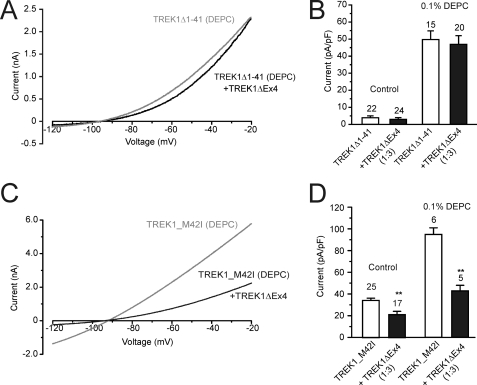
Two-pore domain potassium (K(2P)) channels modulate neuronal excitability throughout the entire CNS. The stretch-activated channel TREK1 (K(2P)2.1) is expressed widely in brain and has been linked to depression, neuroprotection, pain perception, and epilepsy. Little, however, is known about the regulation of TREK1 expression on the transcriptional and translational level or about its trafficking to the plasma membrane. Here we have used PCR techniques to identify a splice variant of TREK1 expressed in the brain, which encodes a heavily truncated TREK1 protein retaining a single transmembrane domain. Functional expression of this splice variant TREK1ΔEx4 in tsA201 cells in the presence or absence of wild type TREK1 revealed that TREK1ΔEx4 has no channel activity itself but reduced TREK1 whole cell current amplitude. Confocal analysis of the expression of fluorescently tagged TREK1 variants revealed that TREK1ΔEx4 is translated, but it is retained in the intracellular compartment. Additionally, TREK1ΔEx4 reduced the level of TREK1 expression in the plasma membrane. Long and short forms of TREK1 derived from alternative translation initiation are differentially affected by TREK1ΔEx4, with the short form (lacking the first 41 amino acids at its N terminus) unaffected. This differential regulatory role of TREK1ΔEx4 will alter the functional profile of TREK1 current in neurons where they are expressed. These results indicate that the N-terminal domain and first transmembrane domain of TREK1 are likely to be important for channel dimerization and trafficking to the plasma membrane.


Figures

FIGURE 1.
FIGURE 1.
Expression pattern of TREK1ΔEx4. A, RT-PCR analysis of TREK1 (K2P2.1, KCNK2) expression in mice and rats. In mice, a 383 bp band corresponds to TREK1, and a 265 bp band corresponds to TREK1ΔEx4(*). In rats, a 574 bp band signifies TREK1, and a 456 bp band indicates TREK1ΔEx4(*). TREK1 was amplified from the brain, heart, liver, and kidney but not from the pancreas. TREK1ΔEx4 was more prominent in the brain than in the heart, liver, and kidney, where it was seen only as a spurious product. B, nucleotide and amino acid sequence of mouse TREK1 (GenBankTM U73488) in the vicinity of exon 4. Nucleotides contributing to exon 4 are shown in a gray box. Note that exon 4 ends with the first nucleotide of the triplet encoding for the first glutamine of the “GFG” potassium channel signature sequence. The loss of exon 4 leads to a frameshift and a premature stop codon (TAG) after a further 37 amino acids. This suggests that TREK1ΔEx4 encodes a heavily truncated protein consisting of only one TM and an extracellular tail. Amino acid residues that are different in the human sequence are indicated in boldface type. Numbering according to the human sequence is shown on the right (GenBankTM AF171068). C, membrane topology of TREK1. The position of exon 4 between TM1 and the pore sequence GFG is indicated in black.
FIGURE 2.
FIGURE 2.
TREK1Δ Ex4 produces no functional current and reduces TREK1 currents. A, topology of TREK1ΔEx4. This variant consists of a homologous N terminus, TM1, and small part of the M1P1 loop up to Glu105 (Q105), followed by 114 bp of frameshifted sequence, which encodes for 37 amino acid residues (see inset) and a stop codon. In total, TREK1ΔEx4 is composed of 675 bp of coding sequence. B, representative traces from TREK1- and TREK1ΔEx4-transfected tsA201 cells with the voltage protocol employed in this study. C, mean current densities for TREK1 and TREK1ΔEx4 and co-expression of TREK1 and TREK1ΔEx4 at the ratios indicated, calculated from the difference in holding current between −80 and −40 mV. TREK1 current density was significantly reduced in a concentration-dependent manner, when co-expressed with TREK1ΔEx4. D, current-voltage relationships for TREK1, TREK1 co-expressed (1:3 ratio) with TREK1ΔEx4, and TREK1ΔEx4 alone. E, co-expression of the inward rectifier Kir6.2 with TREK1 does not reduce the TREK1 current density. Note that Kir6.2 does not form functional K+ channels in the absence of its β-subunit SUR. F, mean current density of TASK3 (K2P3.2, KCNK9) was not significantly affected by co-transfection with TREK1ΔEx4 at a 1:3 ratio. Numbers (n) are given above the bars. *, p < 0.05; **, p < 0.01. Error bars, S.E.
FIGURE 3.
FIGURE 3.
Evaluation of cellular localization of fluorescently labeled TREK1 variants. A, photomicrographs showing cellular localization of TREK1 tagged with GFP (TREK1-GFP) (i) relative to the location of the membrane label DsRed-Mem (ii), determined by confocal microscopy. Nuclei were stained with the blue fluorescent dye Hoechst 33258. Overlay (iii) indicates strong co-localization of TREK1-GFP and DsRed-Mem in yellow. B, co-localization of TREK1-GFP and TREK1ΔEx4 tagged with DsRed2 (TREK1ΔEx4-DsRed2) in individual tsA201 cells. Cells were transfected with both constructs in a 1:1 ratio. Note the strong co-localization indicated by yellow fluorescence (iii). C, i, quantification of the co-localization observed in experiments as shown in A and B. A correlation coefficient of 1 indicates complete overlap of fluorescence, whereas a coefficient of −1 indicates no co-localization at all. C, ii, example of reduced co-localization between TREK1-GFP and DsRed-Mem in the presence of unlabeled TREK1ΔEx4 (1:1 ratio with TREK1-GFP). White scale bar, 10 μm. *, p < 0.05 as compared with TREK1-GFP + DsRed-Mem. Error bars, S.E.
FIGURE 4.
FIGURE 4.
Truncation of TREK1 at glutamine 105 replicates dominant negative effect of TREK1ΔEx4 on TREK1. A, topology of TREK1_Q105X, an N-terminal fragment of TREK1 with a stop codon inserted at glutamine 105 (Q105X). It differs in structure from TREK1ΔEx4 by lacking the additional 37 amino acids of frameshifted sequence following from the glutamine at position 104 (see also Fig. 2). B, current density of TREK1, TREK1_Q105X, and TREK1 co-expressed (1:3 ratio) with TREK1_Q105X. TREK1 whole cell current was significantly reduced when co-expressed with TREK1_Q105X. C, current-voltage relationships for TREK1 and TREK1 co-expressed with TREK1_Q105X. Numbers (n) are given above the bars. *, p < 0.05; **, p < 0.01. Error bars, S.E.
FIGURE 5.
FIGURE 5.
Effects of alternative translation initiation on TREK1 currents and their modification by DEPC. A, topology of TREK1_M42I. This mutation removes the alternative start codon at position 41, ensuring that only a complete full-length channel is transcribed. B, mean current densities of TREK1, TREK1_M42I, and TREK1_M42I after exposure to 0.1% DEPC. C, current-voltage relationships for TREK1_M42I before and after exposure to 0.1% DEPC. D, topology of TREK1Δ1–41, where the first 41 amino acids have been deleted, resulting in an N-terminally truncated TREK1 channel, with Met42 becoming the only translation start point of the channel. E, current density of TREK1, TREK1Δ1–41, and TREK1Δ1–41 after DEPC modification. F, current-voltage relationships for TREK1, TREK1Δ1–41, and TREK1Δ1–41 after DEPC exposure. Arrows indicate the shift in reversal potential observed for TREK1Δ1–41 currents after DEPC toward that observed for TREK1 currents. The inset shows the time course of DEPC-induced increase in TREK1Δ1–41 current. Numbers (n) are given above the bars. **, p < 0.01 compared with TREK1; ##, p < 0.01 compared with absence of DEPC. Error bars, S.E.
FIGURE 6.
FIGURE 6.
TREK1ΔEx4 does not affect TREK1Δ1–41 currents. A, current-voltage relationships for TREK1Δ1–41 alone and co-expressed with TREK1ΔEx4, following preincubation with 0.1% DEPC. B, mean current density (pA/pF) for TREK1Δ1–41 was not significantly affected by co-expression with TREK1ΔEx4 at a 1:3 ratio with or without preincubation in DEPC. C, TREK1ΔEx4 significantly reduced TREK1_M42I currents after preincubation with 0.1% DEPC. D, mean current density (pA/pF) for TREK1_M42I alone and co-expressed with TREK1ΔEx4 at a 1:3 ratio with or without preincubation in DEPC. Numbers (n) are given above the bars. *, p < 0.05; **, p < 0.01. Error bars, S.E.

References

    1. Talley E. M., Lei Q., Sirois J. E., Bayliss D. A. (2000) Neuron 25, 399–410 - PubMed
    1. Millar J. A., Barratt L., Southan A. P., Page K. M., Fyffe R. E., Robertson B., Mathie A. (2000) Proc. Natl. Acad. Sci. U.S.A. 97, 3614–3618 - PMC - PubMed
    1. Goldstein S. A., Bayliss D. A., Kim D., Lesage F., Plant L. D., Rajan S. (2005) Pharmacol. Rev. 57, 527–540 - PubMed
    1. Talley E. M., Solorzano G., Lei Q., Kim D., Bayliss D. A. (2001) J. Neurosci. 21, 7491–7505 - PMC - PubMed
    1. Talley E. M., Sirois J. E., Lei Q., Bayliss D. A. (2003) Neuroscientist 9, 46–56 - PubMed

Publication types

Substances

LinkOut - more resources