. 2010 Jul;22(7):2402-16.
doi: 10.1105/tpc.109.071902. Epub 2010 Jul 6.

The levels of male gametic mitochondrial DNA are highly regulated in angiosperms with regard to mitochondrial inheritance

Affiliations

The levels of male gametic mitochondrial DNA are highly regulated in angiosperms with regard to mitochondrial inheritance

Dan-Yang Wang et al. Plant Cell. 2010 Jul.

Abstract

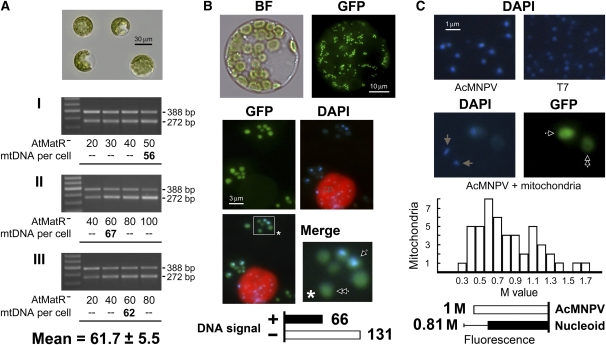
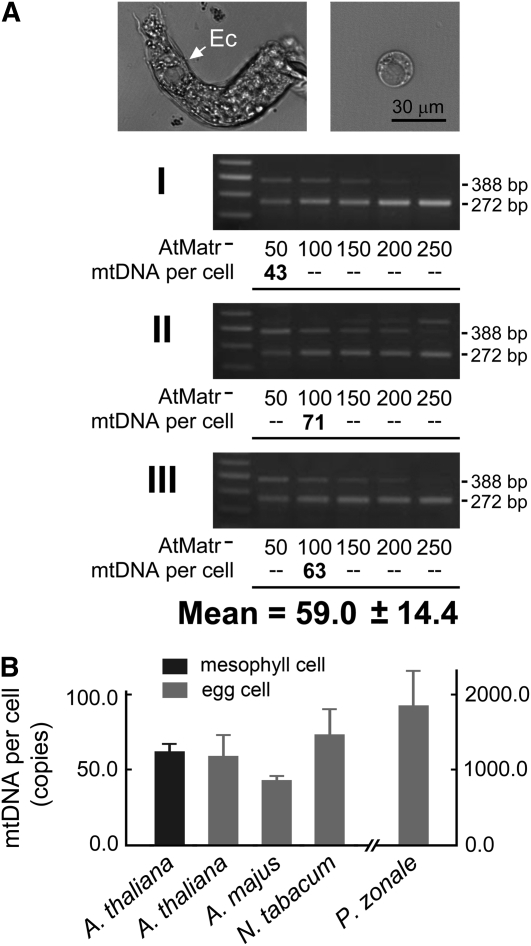
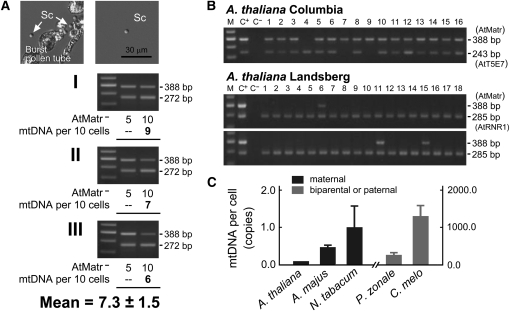
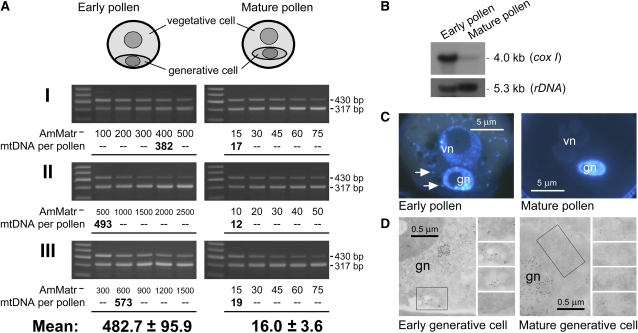
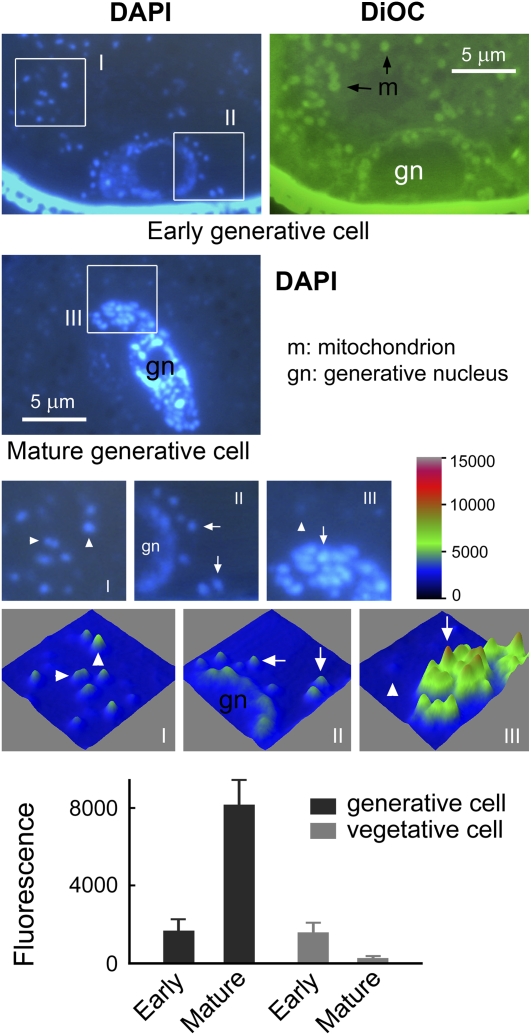
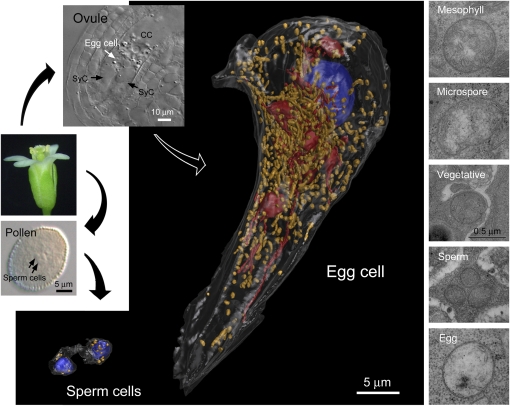
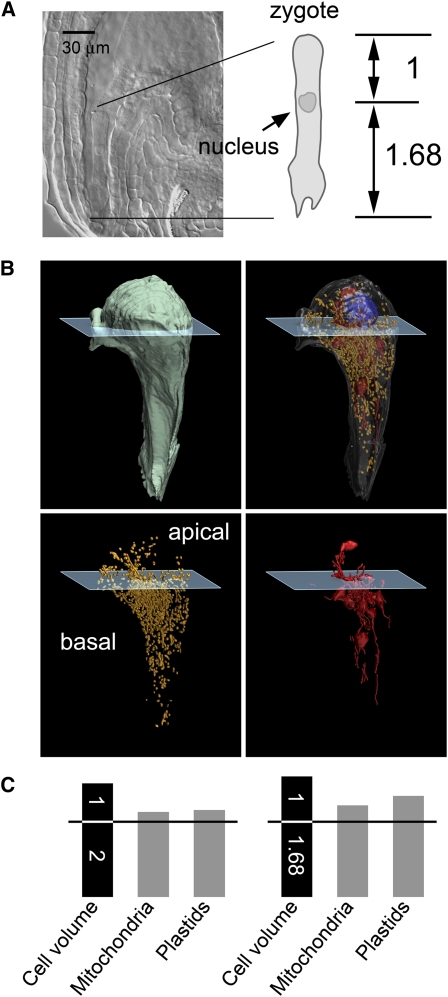
The mechanisms that regulate mitochondrial inheritance are not yet clear, even though it is 100 years since the first description of non-Mendelian genetics. Here, we quantified the copy numbers of mitochondrial DNA (mtDNA) in the gametic cells of angiosperm species. We demonstrate that each egg cell from Arabidopsis thaliana, Antirrhinum majus, and Nicotiana tabacum possesses 59.0, 42.7, and 73.0 copies of mtDNA on average, respectively. These values are equivalent to those in Arabidopsis mesophyll cells, at 61.7 copies per cell. On the other hand, sperm or generative cells from Arabidopsis, A. majus, and N. tabacum possess minor amounts of mtDNA, at 0.083, 0.47, and 1 copy on average, respectively. We further reveal a 50-fold degradation of mtDNA during pollen development in A. majus. In contrast, markedly high levels of mtDNA are found in the male gametic cells of Cucumis melo and Pelargonium zonale (1296.3 and 256.7 copies, respectively). Our results provide direct evidence for mitochondrial genomic insufficiency in the eggs and somatic cells and indicate that a male gamete of an angiosperm may possess mtDNA at concentrations as high as 21-fold (C. melo) or as low as 0.1% (Arabidopsis) of the levels in somatic cells. These observations reveal the existence of a strong regulatory system for the male gametic mtDNA levels in angiosperms with regard to mitochondrial inheritance.


Figures

Figure 1.
Figure 1.
Preparation of Cells for Single-Cell mtDNA Quantification. (A) Living mesophyll, sperm (generative), and egg cells were isolated, purified in mannitol-containing medium, and prepared for PCR. All procedures were monitored with an inverted microscope. A freshly released cell was immediately selected from the isolation plate and washed by repeated pipetting on four serial washing plates containing fresh medium to remove visible contamination. Intact cells became spherical in shape during the washing procedure. (B) An example of egg cell isolation from the Arabidopsis transgenic line (DD45:GFP) expressing green fluorescent protein in the cell. Light images of the ovule and embryo sac were merged with fluorescence images to show localizations of the egg cell.
Figure 2.
Figure 2.
Genomic Insufficiency of Mitochondria in Mesophyll Cells of Arabidopsis. (A) Mesophyll protoplasts were isolated from young leaves of Arabidopsis (ecotype Columbia) and purified (top panel). Three competitive PCR quantifications (I, II, and III) were used to determine the mtDNA levels per cell (bottom three panels). For each quantification, four protoplasts were pretreated by freezing, heating, and proteinase K digestion, and the resulting mixture was divided equally into four PCR tubes. The mtDNA copy number per cell was calculated from the PCR samples, yielding product ratios closest to the previously determined efficiency coefficient (0.80 for Arabidopsis; see Supplemental Figure 4 online). The three quantifications were averaged to obtain the mean value. (B) Mesophyll protoplasts isolated from young leaves of Arabidopsis (ecotype Columbia with transgenic mitochondrial GFP; 35S-mtGFP) were stained with DAPI and visualized under a bright field (BF; top left) and also at the excitation wavelengths for green fluorescent protein (GFP; top right) and DAPI (middle right). Red autofluorescence was observed from a chloroplast (cp) along with chloroplast DNA signals. It is clear that mtDNA signals were not present in a portion of the mitochondria after image merge (bottom left). The blocked area was enlarged (bottom right), and the arrow and double arrow highlight mitochondria with and without mtDNA signals, respectively. A survey of 197 mitochondria revealed that ~66% lacked mtDNA signals. (C) Purified virus particles of AcMNPV and T7 were visualized after staining with DAPI (top left and right). Mesophyll mitochondria were costained along with AcMNPV (bottom left and right). Arrow and double arrows indicate mitochondria with and without mtDNA signals, respectively. Brown arrows indicate AcMNPV particles neighboring the mitochondria. Of the 49 mitochondria observed to have positive mtDNA signals, the mtDNA levels ranged from 0.3 to 1.7 M with an average value of 0.81 M. Error bar represents sd.
Figure 3.
Figure 3.
Levels of mtDNA per Egg Cell in Arabidopsis, A. majus, N. tabacum, and P. zonale. (A) An Arabidopsis (ecotype Columbia) egg cell (Ec) was isolated from a digested embryo sac (top left) and purified (top right). Three quantifications (I, II, and III) using competitive PCR were implemented to determine the amount of mtDNA per cell (bottom three panels). For each quantification, five egg cells were pretreated by freezing, heating, and proteinase K digestion, and the resulting mixture was divided equally into five PCR tubes. The mtDNA copy number per cell was calculated for the PCR sample with a target:competitor product ratio closest to the previously determined efficiency coefficient (0.80 for Arabidopsis; see Supplemental Figure 4 online). The results from the three quantifications were averaged to obtain the mean value. (B) Comparison of the mean mtDNA content per egg cell of Arabidopsis, A. majus, N. tabacum, and P. zonale. Quantifications of egg mtDNA in A. majus, N. tabacum, and P. zonale were performed as described in (A) for Arabidopsis (see Supplemental Figure 5 online). Error bars represent sd.
Figure 4.
Figure 4.
Amounts of mtDNA per Sperm or Generative Cell of Arabidopsis, A. majus, N. tabacum, C. melo, and P. zonale. (A) An Arabidopsis (ecotype Columbia) sperm cell (Sc) was isolated from a burst pollen tube (top left) and purified (top right). Three quantifications (I, II, and III) using competitive PCR were performed to determine the amount of mtDNA per batch of 10 cells (bottom three panels). For each quantification, 20 sperm cells were pretreated by freezing, heating, and proteinase K digestion, and the resulting mixture was divided equally into two PCR tubes. The mtDNA copy number per 10-cell batch was calculated for the PCR sample with a target:competitor product ratio closest to the previously determined efficiency coefficient (0.80 for Arabidopsis; see Supplemental Figure 4 online). The measurements from the three quantifications were then averaged to obtain the mean value. (B) Detection of mtDNA from single sperm cells of Arabidopsis. Using PCR conditions similar to those described in (A), mtDNA was detected in 15 of the 16 sperm cells examined (ecotype Columbia; top panel). An internal control using a single-copy sequence found on chromosome 2 (T5E7; for structural description, see Supplemental Figure 12 online) was also detected, indicating that the quantification procedure might have amplified the known mtDNA insertion in the Columbia nuclear DNA genome. On the other hand, in cells of the ecotype Landsberg (bottom panels), mtDNA was detected in 3 of 36 sperm cells. In this case, a single-copy nuclear sequence (RNR; for structural description, see Supplemental Figure 12 online) was utilized as the internal control. A mesophyll protoplast (C+) and 0.5 μL of cell-free washing medium (C) were used as positive and negative template controls, respectively. (C) Mean mtDNA content per sperm or generative cell in Arabidopsis, A. majus, N. tabacum, C. melo, and P. zonale. Quantifications of sperm mtDNA in these angiosperm species were performed as described in (A) for Arabidopsis (see Supplemental Figure 6 online). Error bars represent sd.
Figure 5.
Figure 5.
Downregulation of A. majus Pollen and Generative Cell mtDNA during Pollen Development. (A) Gently crushed pollen grains of A. majus were subjected to competitive PCR to quantify the mtDNA levels. Three quantification experiments each were performed for early and mature pollen in which five crushed pollen grains were pretreated by freezing, heating, and proteinase K digestion. The resulting mixture was then divided equally into five PCR tubes. The mtDNA copy number per early or mature pollen grain was calculated using the PCR samples with a target:competitor product ratio closest to the previously determined efficiency coefficient (0.66 for A. majus; see Supplemental Figure 4 online). The measurements from the three quantifications were then averaged to obtain the mean values. (B) Analysis of the degradation of A. majus pollen mtDNA by DNA gel blot hybridization. Total DNA extracted from early and mature pollen grains was digested with EcoRI and probed with a coxI fragment. As a loading control, the samples were also probed with a nuclear rDNA fragment. (C) Disappearance of mtDNA fluorescence (arrows) in DAPI-stained pollen sections. The generative cells contain intact mitochondria but no plastids (see Supplemental Figure 7 online). gn, generative nuclei; vn, vegetative nuclei. (D) Reduction in the immunogold DNA labeling intensity in the mitochondria (boxed) of generative cells. Serial electron micrograph sections are shown to the right of each panel.
Figure 6.
Figure 6.
Amplification of Generative mtDNA of C. melo. C. melo pollen sections were stained with DAPI and DiOC6 (a fluorescent dye that stains mitochondria). Mitochondrial nucleoids in an early vegetative cell (I), an early generative cell (II), and mature generative and vegetative cells (III) are boxed in the top panels; these boxes are enlarged in the middle row. Digital analysis of the fluorescence images (nucleoids; n = 15) revealed a 4.9-fold increase in mtDNA fluorescence in the mature generative cell (8176.0, in arbitrary units) compared with the early generative cell (1246.2, in arbitrary units) and simultaneously a sixfold diminution of mtDNA fluorescence in the vegetative cell (1617.8 in the early cell and 269.9 in the mature cell, in arbitrary units) during pollen development. Arrows indicate mitochondrial nucleoids in the generative cell, and arrowheads indicate mitochondrial nucleoids in the vegetative cell. Error bars represent sd.
Figure 7.
Figure 7.
Three-Dimensional Configurations of the Sperm and Egg Cells of Arabidopsis. The cells were reconstructed from serial ultrathin sections to exhibit the number and spatial distribution of mitochondria within the cells. For the quantification results in detail, see Supplemental Table 1 online. The cell nuclei, mitochondria, and plastids are rendered in blue, yellow, and red, respectively. Note that the sperm cells contain markedly smaller mitochondria. Electron microscopic images (at right) further show that the mitochondria of the early microspore are similar in size to those of the egg and mesophyll cells, signifying that the mitochondrial volumes decrease significantly in sperm and vegetative cells during pollen development (for a statistical analysis, see Supplemental Figure 11 online). CC, central cell; SyC, synergid cell.
Figure 8.
Figure 8.
Distribution of Mitochondria and Plastids in the Egg Cell of Arabidopsis. (A) Soon after fertilization, the egg cell of Arabidopsis elongates rapidly to form a tubular zygote, and the first zygote division takes place within the tubular cell (Mansfield and Briarty, 1990). To predict the division plane, we traced a zygotic nucleus during deformation of fertilized egg cells and observed via a clear sample that the nucleus assigns the tubular cell into apical and basal portions at a 1:1.68 length ratio from the apical end. As the cell was almost tubular, we used this length ratio as a ratio of the volume between the apical and basal portions. (B) A computer-generated partition plane separating the egg cell into apical and basal portions with a 1:1.68 ratio of cytoplasm volumes. Mitochondria and plastids were counted from both these portions (see Supplemental Table 1 online). The cell nuclei, mitochondria, and plastids are rendered in blue, yellow, and red, respectively. (C) Distribution of mitochondria and plastids between the apical and basal portions of the egg cell. Relative to the volume of the cell portions (shown by the numbers in the black bars), both the mitochondria and plastids showed a clear tendency toward partitioning into the basal portion, regardless of the partition plane (represented by the horizontal line) used in our analysis (for details, see Supplemental Table 1 online).

Similar articles

Cited by

References

    1. Alam T.I., Kanki T., Muta T., Ukaji K., Abe Y., Nakayama H., Takio K., Hamasaki N., Kang D. (2003). Human mitochondrial DNA is packaged with TFAM. Nucleic Acids Res. 31: 1640–1645 - PMC - PubMed
    1. Ankel-Simons F., Cummins J.M. (1996). Misconceptions about mitochondria and mammalian fertilization: Implications for theories on human evolution. Proc. Natl. Acad. Sci. USA 93: 13859–13863 - PMC - PubMed
    1. Arimura S., Yamamoto J., Aida G.P., Nakazono M., Tsutsumi N. (2004). Frequent fusion and fission of plant mitochondria with unequal nucleoid distribution. Proc. Natl. Acad. Sci. USA 101: 7805–7808 - PMC - PubMed
    1. Baur E. (1909). Das Wesen und die Erblichkeitsverhältnisse der “Varietates albomarginatae hort.” von Pelargonium zonale Z. Indukt. Abstammungs-Vererbungsl. 1: 330–351
    1. Bendich A.J., Gauriloff L.P. (1984). Morphometric analysis of Cucurbit mitochondria: The relationship between chondriome volume and DNA content. Protoplasma 119: 1–7

Publication types

Substances