

The complex nature of serum C3 and C4 as biomarkers of lupus renal flare
- PMID: 20605879
- PMCID: PMC3086056
- DOI: 10.1177/0961203310371154
The complex nature of serum C3 and C4 as biomarkers of lupus renal flare
Abstract
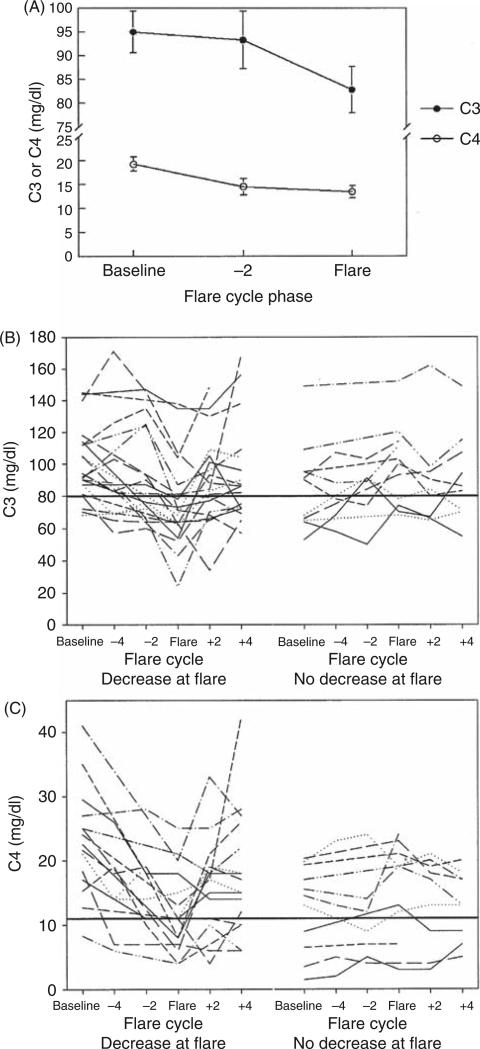
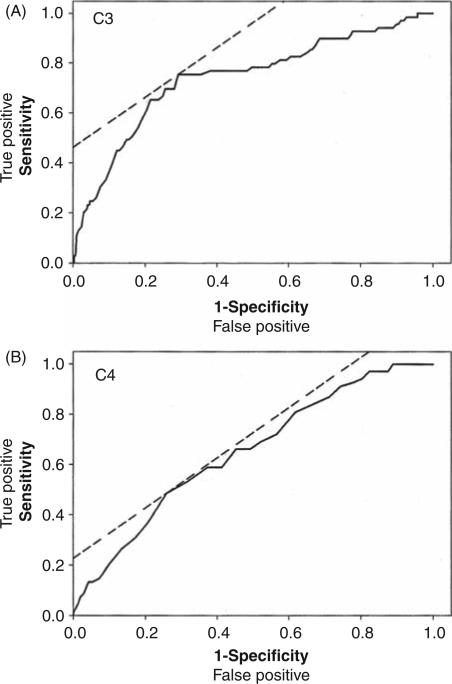
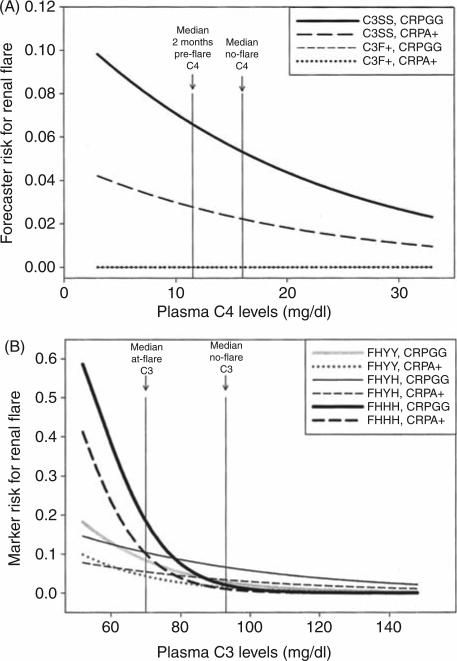
To assess the relationship between serum C3 or C4 levels and lupus renal flare, C3 and C4 levels were measured bimonthly in 71 lupus nephritis patients for a mean of 35 months, during which time 70 renal flares were identified. Comparing baseline, pre-flare, and at-flare values indicated that neither C3 nor C4 levels decreased pre-flare, but both decreased on average significantly at flare. However, sensitivity/specificity for C3 (75%/71%) and C4 (48%/71%) were low. To account for other influencing factors, multiple regression was performed that included bimonthly values of C-reactive protein (CRP) and erythrocyte sedimentation rate (ESR), and genotype data on C3 (S/F), CRP (1846G > A), and the complement regulator factor H (Y402H). This analysis revealed that reduced levels of C4, but not C3, were independently associated with the two-month pre-flare period. Conversely, reduced levels of C3, but not C4, were independently associated with the flare visit. Significant pro-flare interactions included low C3 levels with the factor H 402HH-encoding genotype, and low CRP levels with the C3 F allele. Together these data suggest that C4 activation is critical for initiating renal flare while C3 activation is involved in the actual tissue damage, and that these effects are influenced by genetic variability in complement activation and regulation.
Figures
References
-
- Moroni G, Quaglini S, Maccario M, Banfi G, Ponticelli C. “Nephritic flares” are predictors of bad long-term renal outcome in lupus nephritis. Kidney Int. 1996;50:2047–2053. - PubMed
-
- Bao L, Quigg RJ. Complement in lupus nephritis: the good, the bad, and the unknown. Semin Nephrol. 2007;27:69–80. - PubMed
-
- Esdaile JM, Joseph L, Abrahamowicz M, Li Y, Danoff D, Clarke AE. Routine immunologic tests in systemic lupus erythematosus: is there a need for more studies? J Rheumatol. 1996;23:1891–1896. - PubMed
-
- Esdaile JM, Abrahamowicz M, Joseph L, MacKenzie T, Li Y, Danoff D. Laboratory tests as predictors of disease exacerbations in systemic lupus erythematosus. Why some tests fail. Arthritis Rheum. 1996;39:370–378. - PubMed
-
- Ricker D, Hebert L, Rohde R, Sedmak D, Lewis E, Clough J. Serum C3 levels are diagnostically more sensitive and specific for SLE activity than are serum C4 levels. Am J Kidney Dis. 1991;18:678–685. - PubMed
Publication types
MeSH terms
Substances
Grants and funding
LinkOut - more resources
Full Text Sources
Other Literature Sources
Medical
Research Materials
Miscellaneous
