. 2010 Oct;335(1):2-12.
doi: 10.1124/jpet.110.170084. Epub 2010 Jul 6.

Transcriptional regulation of renal cytoprotective genes by Nrf2 and its potential use as a therapeutic target to mitigate cisplatin-induced nephrotoxicity

Affiliations

Transcriptional regulation of renal cytoprotective genes by Nrf2 and its potential use as a therapeutic target to mitigate cisplatin-induced nephrotoxicity

Lauren M Aleksunes et al. J Pharmacol Exp Ther. 2010 Oct.

Abstract

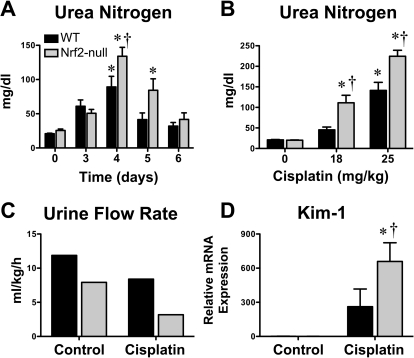
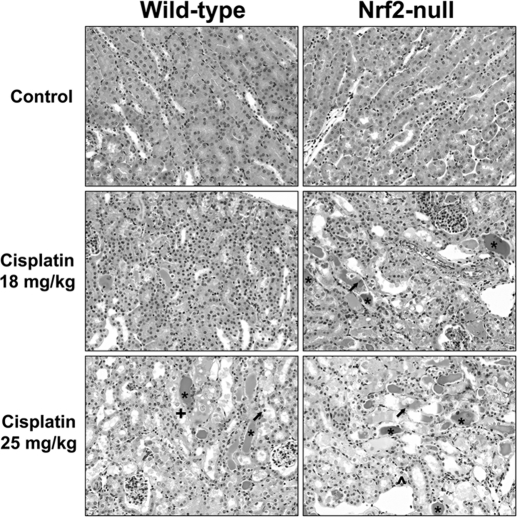
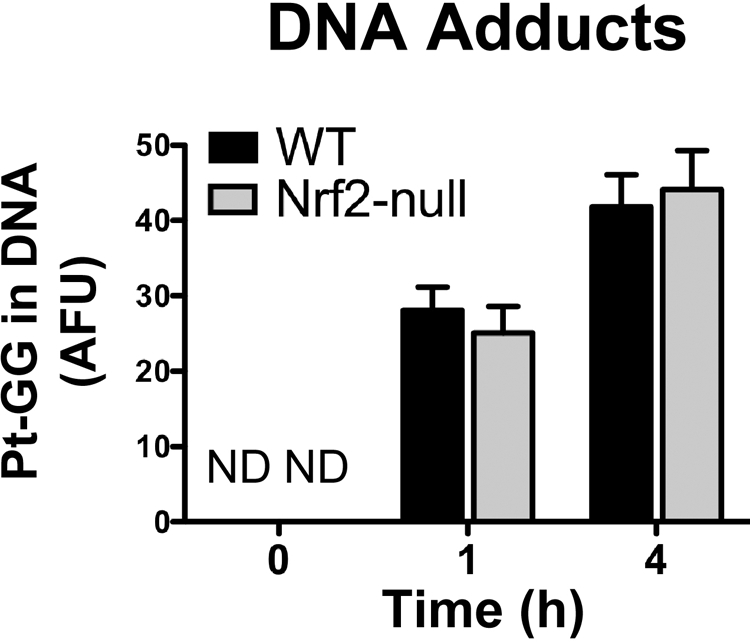
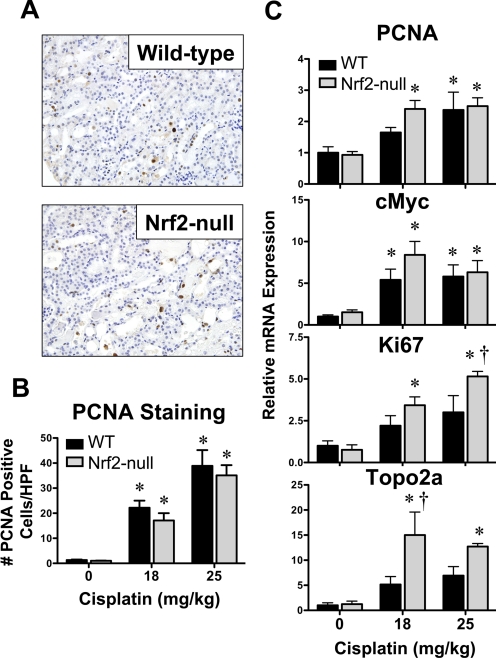
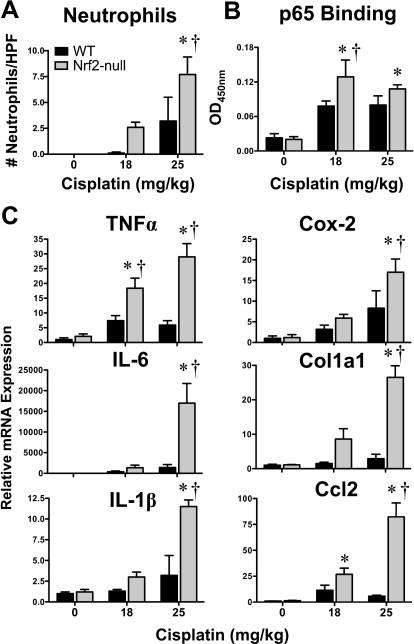
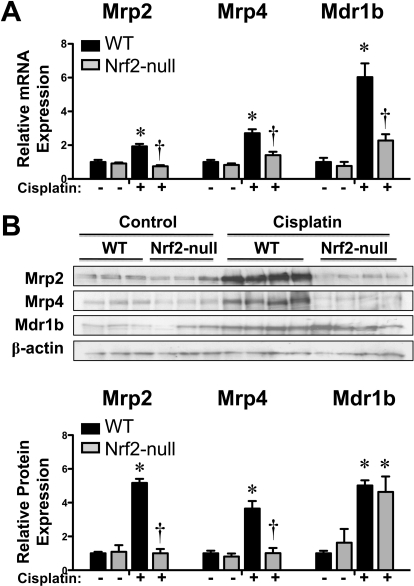
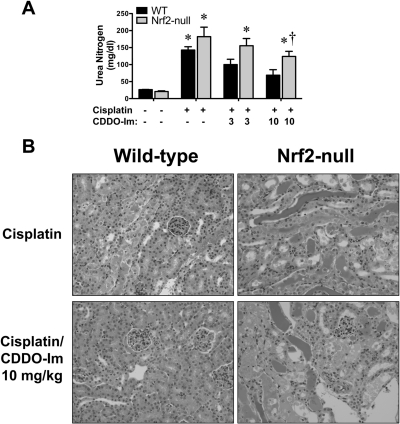
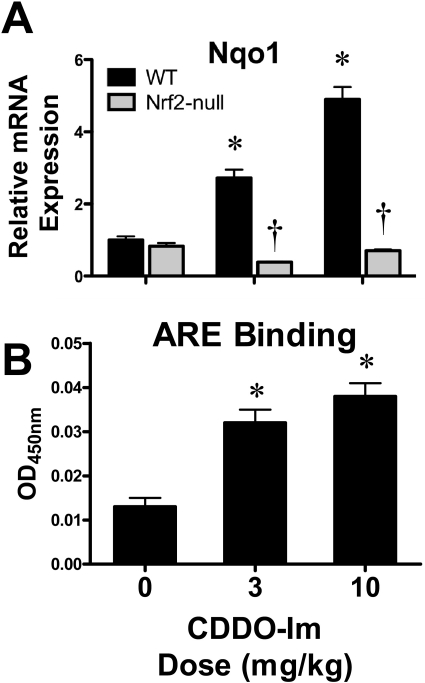
The use of the chemotherapeutic drug cisplatin is limited in part by nephrotoxicity. Cisplatin causes renal DNA adducts and oxidative stress in rodents. The transcription factor Nrf2 (nuclear factor E2-related factor 2) induces expression of cytoprotective genes, including Nqo1 (NADPH:quinone oxidoreductase 1), Ho-1 (heme oxygenase-1), and Gclc (glutamate cysteine ligase catalytic subunit), in response to electrophilic and oxidative stress. In the present study, plasma and kidneys from wild-type and Nrf2-null mice were collected after receiving cisplatin for evaluation of renal injury, inflammation, mRNA, and protein expression. Compared with wild types, more extensive nephrotoxicity was observed in Nrf2-null mice after cisplatin treatment. Kidneys from Nrf2-null mice treated with cisplatin had more neutrophil infiltration accompanied by increased p65 nuclear factor κB binding and elevated inflammatory mediator mRNA levels. Cisplatin increased renal mRNA and protein expression of cytoprotective genes (Nqo1, Ho-1, Gclc) and transporters Mrp2 and Mrp4 in wild-type but not in Nrf2-null mice. Lastly, the Nrf2 activator, CDDO-Im [2-cyano-3,12-dioxooleana-1,9-dien-28-oic imidazolide], increased Nrf2 signaling in kidneys from wild-type mice and protected them from cisplatin toxicity. Collectively, these data indicate that the absence of Nrf2 exacerbates cisplatin renal damage and that pharmacological activation of Nrf2 may represent a novel therapy to prevent kidney injury. Coordinated regulation of detoxification enzymes and drug transporters and suppression of inflammation by Nrf2 during cisplatin nephrotoxicity are probable defense mechanisms to eliminate toxic mediators and promote proximal tubule recovery.


Figures

Fig. 1.
Fig. 1.
Blood urea nitrogen, urinary rate, and kidney injury molecule-1 mRNA expression in wild-type and Nrf2-null mice after cisplatin treatment. A, blood urea nitrogen levels in wild-type and Nrf2-null mice 3 through 6 days after cisplatin (18 mg/kg i.p.) treatment (n = 4–15). B, blood urea nitrogen levels in wild-type and Nrf2-null mice 4 days after vehicle or cisplatin (18 or 25 mg/kg i.p.) treatment (n = 8–14). C, urine flow rate of control and cisplatin (18 mg/kg)-treated wild-type and Nrf2-null mice on day 4. Pooled urine volume was quantified from five to six mice per group in a metabolic cage for 6 h and normalized to body weight and time. D, messenger RNA expression of Kim-1 was quantified using total kidney RNA from control and cisplatin (18 mg/kg)-treated wild-type and Nrf2-null mice on day 4 (n = 4–5). Data are presented as means ± S.E. Messenger RNA data were normalized to wild-type control mice. Black bars represent wild-type mice, and gray bars represent Nrf2-null mice. * represents statistically significant differences (p < 0.05) compared with genotype control mice. † represents a statistically significant difference (p < 0.05) from cisplatin-treated wild-type mice.
Fig. 2.
Fig. 2.
Kidney histopathology in wild-type and Nrf2-null mice after cisplatin treatment. Wild-type and Nrf2-null mice were treated with cisplatin (18 or 25 mg/kg i.p.), and kidneys were collected on day 4. Samples were fixed in formalin before routine processing and paraffin embedding. Sections (5 μm) of kidneys were stained with hematoxylin and eosin and examined by light microscopy for the presence and severity of proximal tubule degeneration, apoptosis, and necrosis as well as renal cast formation and neutrophil infiltration. * denotes representative areas of protein casts (eosinophilic amorphous material); ↑ represents apoptotic cells; + represents tubular degeneration; and ^ represents epithelial cell loss.
Fig. 3.
Fig. 3.
Platinum-DNA adducts in kidneys of wild-type and Nrf2-null mice after cisplatin treatment. Platinum-(GG) DNA adducts were quantified after immunofluorescent staining in frozen kidney sections (5 μm) from vehicle and cisplatin (18 mg/kg)-treated wild-type and Nrf2-null mice at 1 and 4 h according to Liedert et al. (2006). Adduct counts are expressed in arbitrary fluorescence units.
Fig. 4.
Fig. 4.
Proliferation mRNA expression and immunohistochemical staining in kidneys of wild-type and Nrf2-null mice after cisplatin. A, PCNA staining (brown) in cisplatin (18 mg/kg)-treated wild-type and Nrf2-null kidney sections. Sections were counterstained with hematoxylin. Images were acquired at 40× magnification. B, PCNA staining was quantified in paraffin-embedded kidney sections (5 μm) from vehicle and cisplatin (18 and 25 mg/kg)-treated wild-type and Nrf2-null mice on day 4. PCNA-positive nuclei were quantified by counting three high-powered fields at 40× magnification. C, messenger RNA expression of PCNA, c-Myc, Ki67, and Topo2a was quantified using total kidney RNA from control and cisplatin (18 or 25 mg/kg)-treated wild-type and Nrf2-null mice on day 4. Data (n = 4–9) are presented as means ± S.E. Messenger RNA data are normalized to wild-type control mice. Black bars represent wild-type mice, and gray bars represent Nrf2-null mice. * represents statistically significant differences (p < 0.05) compared with genotype control mice. † represents a statistically significant difference (p < 0.05) from cisplatin-treated wild-type mice.
Fig. 5.
Fig. 5.
Neutrophil infiltration, p65 NFκB binding, and inflammatory mediator mRNA expression in kidneys of wild-type and Nrf2-null mice after cisplatin treatment. A, the number of neutrophils in three nonoverlapping high-powered fields were quantified in hematoxylin and eosin-stained kidney sections from vehicle or cisplatin (18 or 25 mg/kg)-treated wild-type and Nrf2-null mice on day 4. B, binding of kidney nuclear extracts from vehicle and cisplatin (18 or 25 mg/kg)-treated mice to p65 NFκB DNA-response element using an ELISA-based format. Data are presented as optical density (OD) at 450 nm. C, messenger RNA expression of tumor necrosis factor α, IL-6, IL-1β, cyclooxygenase 2, Col1a1, and Ccl2 was quantified using total kidney RNA from control and cisplatin (18 or 25 mg/kg)-treated wild-type and Nrf2-null mice on day 4. Data (n = 3–9) are presented as means ± S.E. Messenger RNA data were normalized to wild-type control mice. Black bars represent wild-type mice, and gray bars represent Nrf2-null mice. * represents statistically significant differences (p < 0.05) compared with genotype control mice. † represents a statistically significant difference (p < 0.05) from cisplatin-treated wild-type mice.
Fig. 6.
Fig. 6.
Nrf2 mRNA, DNA binding, and nuclear translocation in kidneys of wild-type and Nrf2-null mice after cisplatin treatment. A, messenger RNA expression of Nrf2 was quantified using total kidney RNA from control and cisplatin (18 or 25 mg/kg)-treated wild-type and Nrf2-null mice on day 4. B, kidney expression of Nrf2 protein was quantified by Western blot in nuclear extracts (50 μg of protein/lane) from cisplatin (18 mg/kg)-treated wild-type and Nrf2-null mice on day 4. Histone H3 was used as a loading control. The Western blot data are presented as individual blots and mean relative protein expression. C, binding of kidney nuclear extracts from vehicle and cisplatin (18 or 25 mg/kg)-treated mice to ARE using an ELISA-based format. Data are presented as optical density (OD) at 450 nm. Data (n = 3–5) are presented as means ± S.E. Messenger RNA and Western blot data are normalized to wild-type control mice. Black bars represent wild-type mice, and gray bars represent Nrf2-null mice. * represents statistically significant differences (p < 0.05) compared with genotype control mice. † represents a statistically significant difference (p < 0.05) from cisplatin-treated wild-type mice. ND, not detected.
Fig. 7.
Fig. 7.
Renal mRNA and protein expression of Nrf2 targets in kidneys of wild-type and Nrf2-null mice after cisplatin. A, messenger RNA expression of Nrf2 targets (Nqo1, Ho-1, and Gclc) was quantified using total kidney RNA from control and cisplatin (18 mg/kg)-treated wild-type and Nrf2-null mice on day 4. B, kidney expression of Nrf2 target proteins (Nqo1, Ho-1, and Gclc) was quantified by Western blot using cytosol (Nqo1, Gclc) and membrane (Ho-1) preparations (50 μg of protein/lane) from cisplatin (18 mg/kg)-treated wild-type and Nrf2-null mice on day 4. β-Actin was used as a loading control. The Western blot data are presented as individual blots and mean relative protein expression. Data (n = 3–6) are normalized to wild-type controls and presented as means ± S.E. Black bars represent wild-type mice, and gray bars represent Nrf2-null mice. * represents statistically significant differences (p < 0.05) compared with genotype control mice. † represents a statistically significant difference (p < 0.05) from cisplatin-treated wild-type mice.
Fig. 8.
Fig. 8.
Renal mRNA and protein expression of efflux Mrp and Mdr transporters in kidneys of wild-type and Nrf2-null mice after cisplatin treatment. A, messenger RNA expression of Mrp2, Mrp4, and Mdr1b transporters was quantified using total kidney RNA from control and cisplatin (18 mg/kg)-treated wild-type and Nrf2-null mice on day 4. B, kidney expression of Mrp2, Mrp4, Mdr1b proteins was quantified by Western blot (50 μg of protein/lane) from cisplatin (18 mg/kg)-treated wild-type and Nrf2-null mice on day 4. β-Actin was used as a loading control. The Western blot data are presented as individual blots and mean relative protein expression. Data (n = 3–6) are normalized to wild-type controls and presented as means ± S.E. Black bars represent wild-type mice, and gray bars represent Nrf2-null mice. * represents statistically significant differences (p < 0.05) compared with genotype control mice. † represents a statistically significant difference (p < 0.05) from cisplatin-treated wild-type mice.
Fig. 9.
Fig. 9.
Immunofluorescent staining of Mrp2 and Mrp4 in kidney sections of wild-type and Nrf2-null mice after cisplatin. Indirect immunofluorescence against brush-border membrane transporters Mrp2 and Mrp4 (green) was conducted on kidney cryosections (5 μm) obtained on day 4 from control and cisplatin (18 mg/kg)-treated wild-type and Nrf2-null mice. Representative cortex regions are shown. Magnification 20×.
Fig. 10.
Fig. 10.
Binding of Nrf2 to Mrp2 promoter ARE in kidneys of wild-type and Nrf2-null mice after cisplatin treatment. Binding of kidney nuclear extracts from vehicle and cisplatin-treated mice to the −185 bp of ARE of the mouse Mrp2 gene using an ELISA-based format. Data are presented as optical density (OD) at 450 nm. Data (n = 3–4) are normalized to wild-type controls and presented as means ± S.E. Black bars represent wild-type mice, and gray bars represent Nrf2-null mice. * represents statistically significant differences (p < 0.05) compared with genotype control mice. † represents a statistically significant difference (p < 0.05) from cisplatin-treated wild-type mice.
Fig. 11.
Fig. 11.
Effect of CDDO-Im on cisplatin-induced nephrotoxicity in wild-type and Nrf2-null mice. A, wild-type and Nrf2-null mice were administered CDDO-Im (3 or 10 mg/kg per day p.o.) for 2 days, challenged with cisplatin (20 mg/kg i.p.), and evaluated 4 days later for changes in blood urea nitrogen. Data (n = 3–7) are presented as means ± S.E. Black bars represent wild-type mice, and gray bars represent Nrf2-null mice. * represents statistically significant differences (p < 0.05) compared with genotype control mice. † represents a statistically significant difference (p < 0.05) from cisplatin-treated wild-type mice. B, samples were fixed in zinc formalin prior to routine processing and paraffin embedding. Sections (5 μm) of kidneys were stained with hematoxylin and eosin and examined by light microscopy for the presence and severity of proximal tubule degeneration, apoptosis, and necrosis as well as renal cast formation and neutrophil infiltration.
Fig. 12.
Fig. 12.
Effect of CDDO-Im on renal Nrf2 DNA binding and target gene expression in wild-type and Nrf2-null mice. A, messenger RNA expression of Nqo1 was quantified using total kidney RNA from control and CDDO-Im (3 or 10 mg/kg per day for 2 days p.o.)-treated wild-type and Nrf2-null mice 24 h after the last dose. B, binding of kidney nuclear extracts from vehicle and CDDO-Im-treated mice to the ARE using an ELISA-based format. Data are presented as optical density (OD) at 450 nm. Data (n = 3–5) are normalized to wild-type controls and presented as means ± S.E. Black bars represent wild-type mice, and gray bars represent Nrf2-null mice. * represents statistically significant differences (p < 0.05) compared with genotype control mice. † represents a statistically significant difference (p < 0.05) from cisplatin-treated wild-type mice.

References

    1. Aleksunes LM, Augustine LM, Scheffer GL, Cherrington NJ, Manautou JE. (2008) Renal xenobiotic transporters are differentially expressed in mice following cisplatin treatment. Toxicology 250:82–88 - PMC - PubMed
    1. Aleksunes LM, Manautou JE. (2007) Emerging role of Nrf2 in protecting against hepatic and gastrointestinal disease. Toxicol Pathol 35:459–473 - PubMed
    1. Aleksunes LM, Yeager RL, Klaassen CD. (2009) Application of multivariate statistical procedures to identify transcription factors that correlate with MRP2, 3, and 4 mRNA in adult human livers. Xenobiotica 39:514–522 - PMC - PubMed
    1. Boesch-Saadatmandi C, Wagner AE, Graeser AC, Hundhausen C, Wolffram S, Rimbach G. (2009) Ochratoxin A impairs Nrf2-dependent gene expression in porcine kidney tubulus cells. J Anim Physiol Anim Nutr (Berl) 93:547–554 - PubMed
    1. Chen J, Shaikh ZA. (2009) Activation of Nrf2 by cadmium and its role in protection against cadmium-induced apoptosis in rat kidney cells. Toxicol Appl Pharmacol 241:81–89 - PubMed

Publication types

MeSH terms