. 2010 Jul 20;122(3):282-92.
doi: 10.1161/CIRCULATIONAHA.110.953208. Epub 2010 Jul 6.

Impaired macrophage migration inhibitory factor-AMP-activated protein kinase activation and ischemic recovery in the senescent heart

Affiliations

Impaired macrophage migration inhibitory factor-AMP-activated protein kinase activation and ischemic recovery in the senescent heart

Heng Ma et al. Circulation. .

Abstract

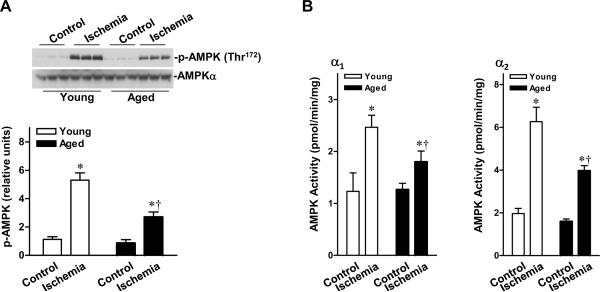
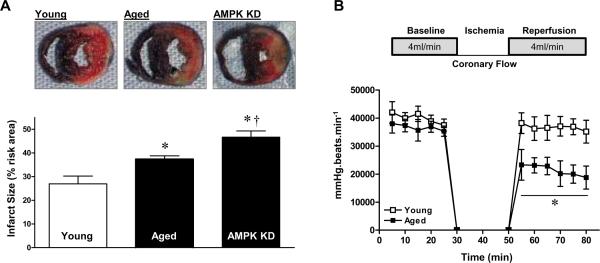
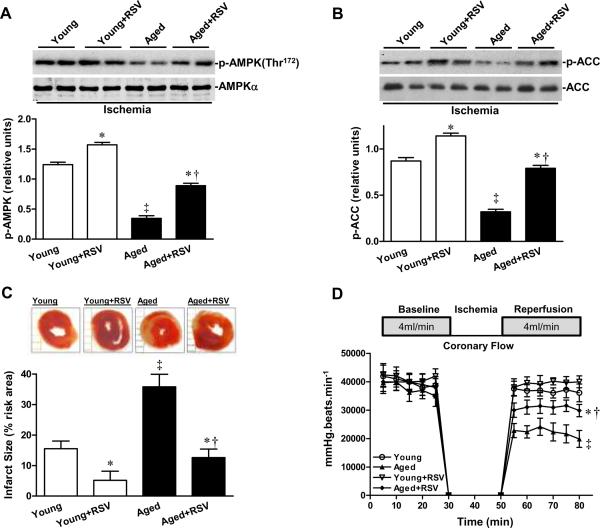
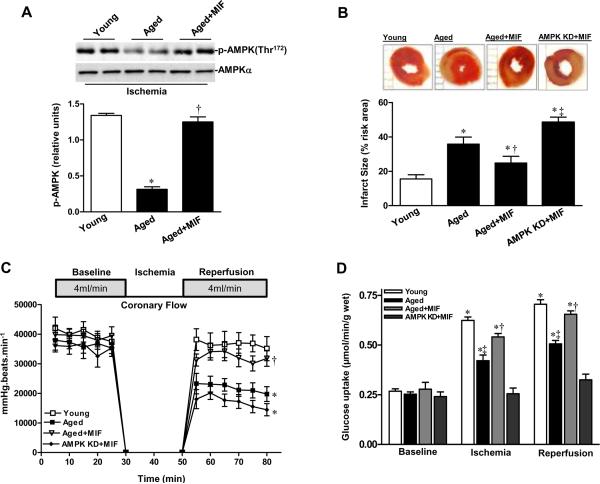
Background: Elderly patients are more sensitive than younger patients to myocardial ischemia, which results in higher mortality. We investigated how aging affects the cardioprotective AMP-activated protein kinase (AMPK) signaling pathway.

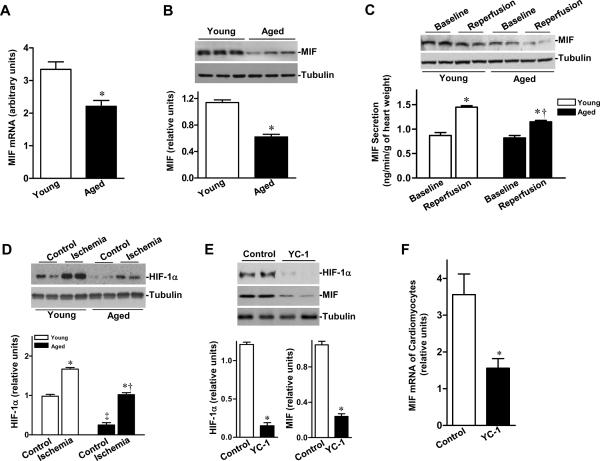
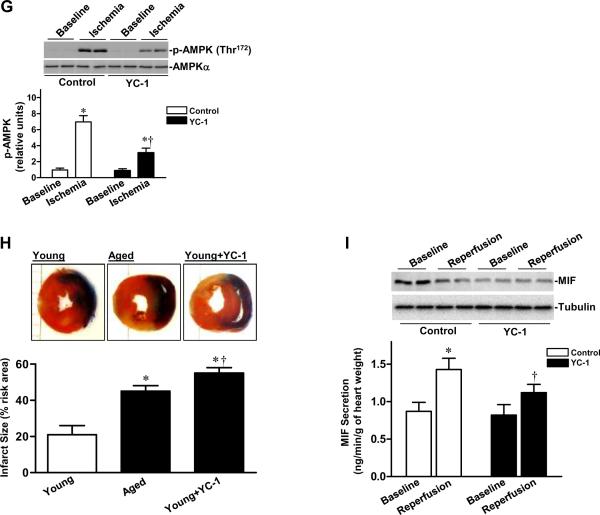
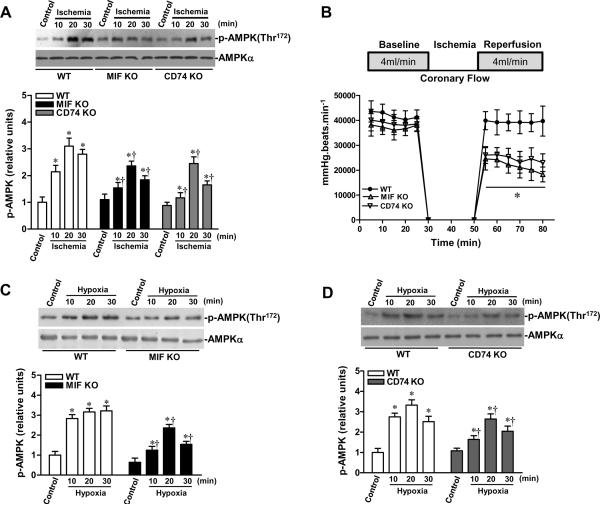
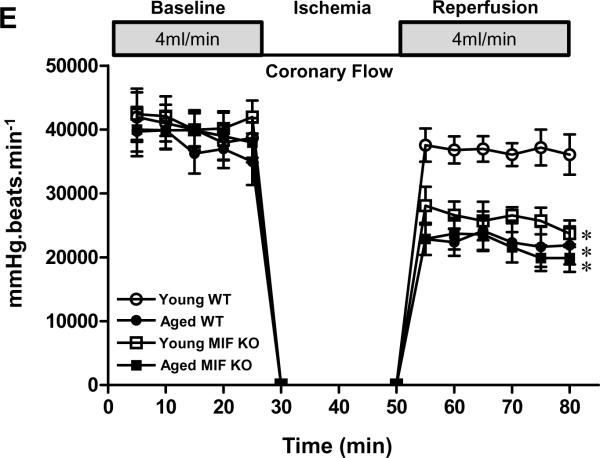
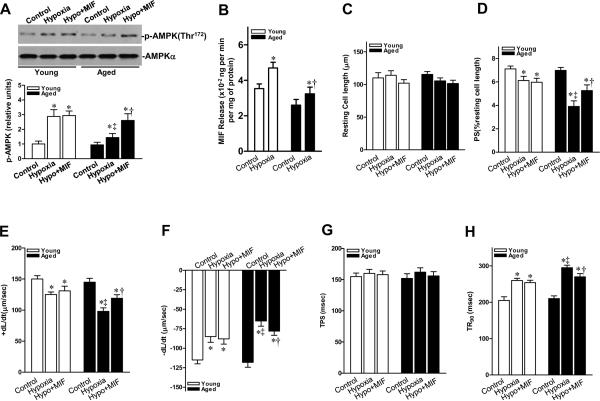
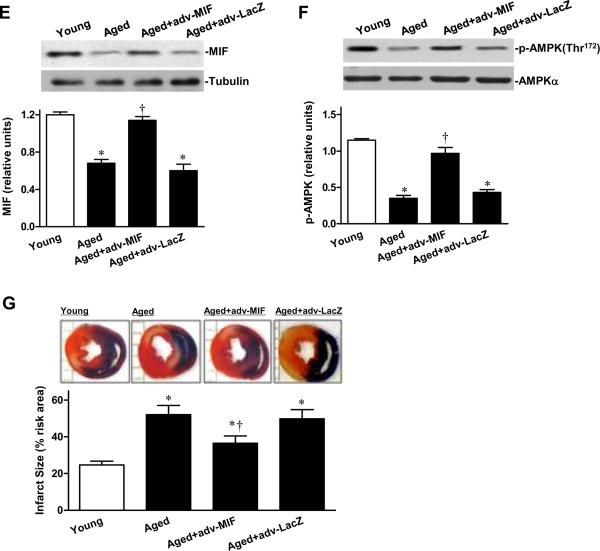
Methods and results: Ischemic AMPK activation was impaired in aged compared with young murine hearts. The expression and secretion of the AMPK upstream regulator, macrophage migration inhibitory factor (MIF), were lower in aged compared with young adult hearts. Additionally, the levels of hypoxia-inducible factor 1alpha, a known transcriptional activator of MIF, were reduced in aged compared with young hearts. Ischemia-induced AMPK activation in MIF knockout mice was blunted, leading to greater contractile dysfunction in MIF-deficient than in wild-type hearts. Furthermore, intramyocardial injection of adenovirus encoding MIF in aged mice increased MIF expression and ischemic AMPK activation and reduced infarct size.

Conclusions: An impaired MIF-AMPK activation response in senescence thus may be attributed to an aging-associated defect in hypoxia-inducible factor 1alpha, the transcription factor for MIF. In the clinical setting, impaired cardiac hypoxia-inducible factor 1alpha activation and consequent reduced MIF expression may play an important role in the increased susceptibility to myocardial ischemia observed in older cardiac patients.


Figures

Figure 1
Figure 1
Impaired ischemic AMPK activation in aged hearts. A, In vivo regional ischemia (20 min) stimulates differential phosphorylation of AMPK in ischemic area of the hearts, as assessed by immunobloting. B, Differential activation of AMPKα1 and AMPKα2 in the ischemic area of hearts, as assessed by kinase assay. Values are means ± SEM, n=6 per group. *P<0.01 vs. control, respectively; †P<0.01 vs. young ischemia, respectively.
Figure 2
Figure 2
Intolerance of aged hearts during ischemia/reperfusion. A, Hearts were subjected to in vivo regional ischemia (20 min)/reperfusion (4 hr), and dual staining to assess the extent of myocardial necrosis (upper panel). Bars represent the per cent of ischemic area at risk in young, aged and young AMPK KD hearts (lower panel). Values are means ± SEM, n=4–5 per group. *P<0.05 vs. young; †P=0.02 vs. aged. B, Young and aged hearts were subjected to ex vivo ischemia (20 min)/reperfusion (30 min), and heart rate-left ventricular pressure product was assessed. Values are means ± SEM, n=4 per group. *P=0.006 vs. young.
Figure 3
Figure 3
Resveratrol (RSV) activation of AMPK suppresses ischemic injury in aged hearts. The phosphorylation of A, AMPK and B, ACC of isolated young and aged heart during ex vivo global ischemia with or without RSV (10 μmol/L) treatment, n=4 per group, *P<0.05 vs. young or aged, respectively; †P=0.03 vs. young+RSV; P=0.01 vs. young. C, The percent of infarct size of isolated young and aged heart with or without RSV treatment. Values are means ± SEM, n=5 per group. *P<0.05 vs. young or aged, respectively; †P=0.03 vs. young+RSV; P=0.01 vs. young. D, Heart rate-left ventricular pressure product of isolated young and aged heart with or without RSV treatment. Values are means ± SEM, n=5 per group. *P=0.02 vs. aged; †P=0.03 vs. young+RSV; P=0.01 vs. young.
Figure 4
Figure 4
Cardiac MIF-AMPK axis in young and aged hearts. A, Quantitative PCR for MIF expression of non-perfused heart as described in the Supplemental Methods, n=4 per group, *P=0.01 vs. young. B, The relative levels of MIF of non-perfused hearts after normalization to β-tubulin, n=5 per group, *P=0.001 vs. young. C, MIF content in heart homogenates from young and aged hearts after control perfusion (baseline) or after ischemia and reperfusion (reperfusion) (upper panel), bars show the rates of coronary effluent MIF production from young and aged hearts during normal perfusion or washed out following 20 min of ischemia, MIF concentration was measured by ELISA and multiplied by the coronary flow rate to calculate the production rate, n=5 per group. *P<0.05 vs. baseline, respectively; †P=0.03 vs. young reperfusion. D, Levels of HIF-1α in ischemic area of young vs. aged hearts during sham control or in vivo regional ischemia (20 min), n=4 per group. *P<0.05 vs. control, respectively; P=0.01 vs. young control; †P=0.02 vs. young ischemia. E, The relative levels of HIF-1α and MIF proteins from young control or HIF-1α inhibitor (YC-1) treated hearts, n=3–4 per group, *P<0.01 vs. control, respectively. F, Quantitative PCR for MIF mRNA in isolated cardiomyocytes from young control or YC-1 treated hearts, n= 4 per group *P=0.01 vs. control. G, Phosphorylation of AMPK from young control or YC-1 treated hearts during ex vivo ischemia (20 min), n=6 per group, *P<0.05 vs. baseline, respectively; †P=0.01 vs. control ischemia. H, Hearts were subjected to in vivo regional ischemia (20 min)/reperfusion (4 hr), and dual staining to assess the extent of myocardial necrosis (upper panel). Bars represent the percent of infarct size to area-at-risk in young, aged and young YC-1 treated hearts (lower panel), n=4 per group, *P<0.05 vs. young, respectively; †P=0.03 vs. aged. I, Immunoblots of MIF content in heart homogenates from young control and YC-1 treated hearts after control perfusion (baseline) or after ischemia and reperfusion (reperfusion) (upper panel), bars show the rates of coronary effluent MIF production from young control or YC-1 treated hearts during normal perfusion or washed out following 20 minutes of ischemia, MIF concentration was measured by ELISA and multiplied by the coronary flow rate to calculate the production rate, n=4 per group, *P=0.01 vs. baseline; †P=0.03 vs. control reperfusion.
Figure 4
Figure 4
Cardiac MIF-AMPK axis in young and aged hearts. A, Quantitative PCR for MIF expression of non-perfused heart as described in the Supplemental Methods, n=4 per group, *P=0.01 vs. young. B, The relative levels of MIF of non-perfused hearts after normalization to β-tubulin, n=5 per group, *P=0.001 vs. young. C, MIF content in heart homogenates from young and aged hearts after control perfusion (baseline) or after ischemia and reperfusion (reperfusion) (upper panel), bars show the rates of coronary effluent MIF production from young and aged hearts during normal perfusion or washed out following 20 min of ischemia, MIF concentration was measured by ELISA and multiplied by the coronary flow rate to calculate the production rate, n=5 per group. *P<0.05 vs. baseline, respectively; †P=0.03 vs. young reperfusion. D, Levels of HIF-1α in ischemic area of young vs. aged hearts during sham control or in vivo regional ischemia (20 min), n=4 per group. *P<0.05 vs. control, respectively; P=0.01 vs. young control; †P=0.02 vs. young ischemia. E, The relative levels of HIF-1α and MIF proteins from young control or HIF-1α inhibitor (YC-1) treated hearts, n=3–4 per group, *P<0.01 vs. control, respectively. F, Quantitative PCR for MIF mRNA in isolated cardiomyocytes from young control or YC-1 treated hearts, n= 4 per group *P=0.01 vs. control. G, Phosphorylation of AMPK from young control or YC-1 treated hearts during ex vivo ischemia (20 min), n=6 per group, *P<0.05 vs. baseline, respectively; †P=0.01 vs. control ischemia. H, Hearts were subjected to in vivo regional ischemia (20 min)/reperfusion (4 hr), and dual staining to assess the extent of myocardial necrosis (upper panel). Bars represent the percent of infarct size to area-at-risk in young, aged and young YC-1 treated hearts (lower panel), n=4 per group, *P<0.05 vs. young, respectively; †P=0.03 vs. aged. I, Immunoblots of MIF content in heart homogenates from young control and YC-1 treated hearts after control perfusion (baseline) or after ischemia and reperfusion (reperfusion) (upper panel), bars show the rates of coronary effluent MIF production from young control or YC-1 treated hearts during normal perfusion or washed out following 20 minutes of ischemia, MIF concentration was measured by ELISA and multiplied by the coronary flow rate to calculate the production rate, n=4 per group, *P=0.01 vs. baseline; †P=0.03 vs. control reperfusion.
Figure 5
Figure 5
Impaired AMPK signaling in MIF KO and MIF receptor (CD74) KO hearts. A, MIF KO, CD74 KO and WT mice were subjected to in vivo regional ischemia by LAD occlusion for either10, 20, or 30 min to determine the degree of ischemic AMPK activation (upper panel). Bars represent the relative levels of p-AMPK (lower panel). n=6 per group, *P<0.01 vs. control, respectively; †P<0.05 vs. WT ischemia, respectively. B, Heart rate-left ventricular pressure product of isolated WT, MIF KO and CD74 KO hearts, n=4 per group, *P<0.05 (both MIF KO and CD74 KO) vs. WT. C and D, The kinetics of AMPK phosphorylation induced by hypoxia in WT, MIF KO and CD74 KO cardiomyocytes, n=6 per group, *P<0.05 vs. control, respectively; †P<0.05 vs. WT hypoxia, respectively. E, Heart rate-left ventricular pressure product of isolated young and aged WT hearts, young and aged MIF KO hearts, n=4 per group. *P<0.05 vs. young WT, respectively.
Figure 5
Figure 5
Impaired AMPK signaling in MIF KO and MIF receptor (CD74) KO hearts. A, MIF KO, CD74 KO and WT mice were subjected to in vivo regional ischemia by LAD occlusion for either10, 20, or 30 min to determine the degree of ischemic AMPK activation (upper panel). Bars represent the relative levels of p-AMPK (lower panel). n=6 per group, *P<0.01 vs. control, respectively; †P<0.05 vs. WT ischemia, respectively. B, Heart rate-left ventricular pressure product of isolated WT, MIF KO and CD74 KO hearts, n=4 per group, *P<0.05 (both MIF KO and CD74 KO) vs. WT. C and D, The kinetics of AMPK phosphorylation induced by hypoxia in WT, MIF KO and CD74 KO cardiomyocytes, n=6 per group, *P<0.05 vs. control, respectively; †P<0.05 vs. WT hypoxia, respectively. E, Heart rate-left ventricular pressure product of isolated young and aged WT hearts, young and aged MIF KO hearts, n=4 per group. *P<0.05 vs. young WT, respectively.
Figure 6
Figure 6
Recombinant MIF restores the contractility of aged cardiomyocytes. A, Immunoblots of p-AMPK of young and aged cardiomyocyte with or without MIF (10 ng/mL) treatment (upper panel). Bars represent the relative levels of p-AMPK (lower panel), n=4 per group, *P<0.05 vs. control, respectively; P=0.03 vs. young hypoxia, †P=0.02 vs. aged hypoxia. B, MIF release from young and aged cardiomyocytes in response to hypoxia treatment, n=4 per group, *P<0.05 vs. control, respectively; †P=0.04 vs. young hypoxia. C, Resting cell length; D, Peak shortening (PS, normalized to cell length); E, Maximal velocity of shortening (+dL/dt) and F, re-lengthening (−dL/dt); G, Time-to-PS (TPS) and H, Time-to-90% relengthening (TR90). For C-H, n = 60–90 cells per group, *P<0.05 vs. control, respectively; P<0.05 vs. young hypoxia, respectively; †P<0.05 vs. aged hypoxia, respectively.
Figure 7
Figure 7
Supplemental MIF restores ischemic AMPK signaling in aged heart. A, Phosphorylation of AMPK in isolated young and aged hearts pretreated with or without MIF (10 ng/mL) during ex vivo global ischemia, n=4 per group, *P=0.01 vs. young; †P=0.01 vs. aged. B, The percent of infarct size to area-at-risk of isolated young, aged and AMPK KD hearts subjected to ex vivo global ischemia (20 min)/reperfusion (2 hr), n=4 per group. *P<0.05 vs. young, respectively; †P=0.03 vs. aged; P=0.01 vs. aged+MIF. C, The heart rate-left ventricular pressure products of isolated young, aged and AMPK KD hearts with or without MIF treatment, n=4 per group, *P<0.05 vs. young, respectively; †P=0.01 vs. aged. D, Glucose uptake under baseline, ischemia and reperfusion in hearts from young, aged and AMPK KD mice supplemented with or without recombinant MIF, n=5 per group. *P<0.05 vs. baseline, respectively; P<0.05 vs. young ischemia or reperfusion, respectively; †P<0.05 vs. aged ischemia or reperfusion, respectively. E, The expression levels of cardiac MIF (upper panel). Bars represent the relative levels of MIF protein (lower panel), n=4 per group, *P<0.05 vs. young, respectively; †P=0.01 vs. aged. F, Phosphorylation of AMPK in ischemic area of young, aged, and aged hearts with intra-myocardial adv-MIF during in vivo regional ischemia (20 min), n=4 per group, *P<0.05 vs. young, respectively; †P=0.01 vs. aged. G, The percent of infarct size to area-at-risk of young, aged and aged hearts with adv-MIF or adv-LacZ treatment, all were subjected to in vivo regional ischemia (20 min)/reperfusion (4 hr) (upper panel). Bars represent the percent of infarct size to area-at-risk (lower panel), n=5 per group, *P<0.05 vs. young, respectively; †P=0.02 vs. aged.
Figure 7
Figure 7
Supplemental MIF restores ischemic AMPK signaling in aged heart. A, Phosphorylation of AMPK in isolated young and aged hearts pretreated with or without MIF (10 ng/mL) during ex vivo global ischemia, n=4 per group, *P=0.01 vs. young; †P=0.01 vs. aged. B, The percent of infarct size to area-at-risk of isolated young, aged and AMPK KD hearts subjected to ex vivo global ischemia (20 min)/reperfusion (2 hr), n=4 per group. *P<0.05 vs. young, respectively; †P=0.03 vs. aged; P=0.01 vs. aged+MIF. C, The heart rate-left ventricular pressure products of isolated young, aged and AMPK KD hearts with or without MIF treatment, n=4 per group, *P<0.05 vs. young, respectively; †P=0.01 vs. aged. D, Glucose uptake under baseline, ischemia and reperfusion in hearts from young, aged and AMPK KD mice supplemented with or without recombinant MIF, n=5 per group. *P<0.05 vs. baseline, respectively; P<0.05 vs. young ischemia or reperfusion, respectively; †P<0.05 vs. aged ischemia or reperfusion, respectively. E, The expression levels of cardiac MIF (upper panel). Bars represent the relative levels of MIF protein (lower panel), n=4 per group, *P<0.05 vs. young, respectively; †P=0.01 vs. aged. F, Phosphorylation of AMPK in ischemic area of young, aged, and aged hearts with intra-myocardial adv-MIF during in vivo regional ischemia (20 min), n=4 per group, *P<0.05 vs. young, respectively; †P=0.01 vs. aged. G, The percent of infarct size to area-at-risk of young, aged and aged hearts with adv-MIF or adv-LacZ treatment, all were subjected to in vivo regional ischemia (20 min)/reperfusion (4 hr) (upper panel). Bars represent the percent of infarct size to area-at-risk (lower panel), n=5 per group, *P<0.05 vs. young, respectively; †P=0.02 vs. aged.

References

    1. Rubino A, Yellon DM. Ischaemic preconditioning of the vasculature: an overlooked phenomenon for protecting the heart? Trends Pharmacol Sci. 2000;21:225–230. - PubMed
    1. Starnes JW, Bowles DK, Seiler KS. Myocardial injury after hypoxia in immature, adult and aged rats. Aging (Milano) 1997;9:268–276. - PubMed
    1. Mariani J, Ou R, Bailey M, Rowland M, Nagley P, Rosenfeldt F, Pepe S. Tolerance to ischemia and hypoxia is reduced in aged human myocardium. J Thorac Cardiovasc Surg. 2000;120:660–667. - PubMed
    1. Abete P, Napoli C, Santoro G, Ferrara N, Tritto I, Chiariello M, Rengo F, Ambrosio G. Age-related decrease in cardiac tolerance to oxidative stress. J Mol Cell Cardiol. 1999;31:227–236. - PubMed
    1. Jansen-Durr P, Osiewacz HD. Healthy ageing: a question of stress, damage and repair. Meeting on mechanisms of biological ageing. EMBO Rep. 2002;3:1127–1132. - PMC - PubMed

Publication types

MeSH terms