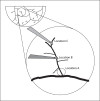
Downstream exposure to growth factors causes elevated velocity and dilation in arteriolar networks
- PMID: 20606467
- PMCID: PMC3214951
- DOI: 10.1159/000317396
Downstream exposure to growth factors causes elevated velocity and dilation in arteriolar networks
Abstract
Our goal was to characterize changes in flow and diameter with vascular endothelial cell growth factor A (VEGF-A) and fibroblast growth factor 2 (FGF2). Observations were made in arteriolar networks of the cheek pouch tissue in anesthetized hamsters (pentobarbital 70 mg/kg, i.p., n = 45). Local and remote dilation responses to micropipette-applied VEGF or FGF2 yielded similar EC(50) values. The role of gap junctions in the remote response was tested by applying sucrose, halothane or 18αGA to the feed arteriole midway between the remote stimulation and upstream observation sites; all remote dilation to FGF2 was prevented, while only the early dilation to VEGF was blocked. The remote dilation to VEGF displayed a second rheologic mechanism. The second mechanism involved an abrupt increase in upstream velocity and shear rate, followed by nitro-arginine sensitive dilation. To test whether the abrupt increase in shear could be caused by other agents known to cause edema, remote responses to histamine and thrombin were tested. Each caused an abrupt increase in velocity followed by nitro-arginine-sensitive dilation. This study shows that VEGF or agents that increase permeability can initiate an upstream velocity increase with dilation that recruits flow to the network; this is in addition to simultaneous gap junction-mediated dilation.
Copyright © 2010 S. Karger AG, Basel.
Figures


Similar articles
-
Mechanisms initiating integrin-stimulated flow recruitment in arteriolar networks.J Appl Physiol (1985). 2007 Jun;102(6):2279-87. doi: 10.1152/japplphysiol.00537.2006. Epub 2007 Mar 22. J Appl Physiol (1985). 2007. PMID: 17379749
-
Remote arteriolar dilations in response to muscle contraction under capillaries.Am J Physiol Heart Circ Physiol. 2000 Jun;278(6):H1916-23. doi: 10.1152/ajpheart.2000.278.6.H1916. Am J Physiol Heart Circ Physiol. 2000. PMID: 10843889
-
Increased flow precedes remote arteriolar dilations for some microapplied agonists.Am J Physiol Heart Circ Physiol. 2000 Apr;278(4):H1186-95. doi: 10.1152/ajpheart.2000.278.4.H1186. Am J Physiol Heart Circ Physiol. 2000. PMID: 10749713
-
Connexin expression and conducted vasodilation along arteriolar endothelium in mouse skeletal muscle.J Appl Physiol (1985). 2004 Sep;97(3):1152-8. doi: 10.1152/japplphysiol.00133.2004. Epub 2004 May 28. J Appl Physiol (1985). 2004. PMID: 15169746
-
Local and remote arteriolar dilations initiated by skeletal muscle contraction.Am J Physiol Heart Circ Physiol. 2000 Nov;279(5):H2285-94. doi: 10.1152/ajpheart.2000.279.5.H2285. Am J Physiol Heart Circ Physiol. 2000. PMID: 11045964
Cited by
-
Computer-assisted image analysis of agonist-mediated microvascular constriction response in mouse cremaster muscle.PLoS One. 2022 Nov 17;17(11):e0277851. doi: 10.1371/journal.pone.0277851. eCollection 2022. PLoS One. 2022. PMID: 36395282 Free PMC article.
-
Curcumin mediates both dilation and constriction of peripheral arterioles via adrenergic receptors.J Invest Dermatol. 2011 Aug;131(8):1754-60. doi: 10.1038/jid.2011.96. Epub 2011 Apr 28. J Invest Dermatol. 2011. PMID: 21525885 Free PMC article.
-
Vasoactive effects of stable aqueous suspensions of single walled carbon nanotubes in hamsters and mice.Nanotoxicology. 2014 Dec;8(8):867-75. doi: 10.3109/17435390.2013.837209. Epub 2013 Sep 30. Nanotoxicology. 2014. PMID: 23992463 Free PMC article.
-
Vasoactive effect of fibronectin-derived epiviosamine-1 and related peptides in quiescent and stress models.Microcirculation. 2017 Aug;24(6):10.1111/micc.12369. doi: 10.1111/micc.12369. Microcirculation. 2017. PMID: 28296053 Free PMC article.
-
In vitro hematological and in vivo vasoactivity assessment of dextran functionalized graphene.Sci Rep. 2013;3:2584. doi: 10.1038/srep02584. Sci Rep. 2013. PMID: 24002570 Free PMC article.
References
-
- Ferrara N, Gerber HP, LeCouter J. The biology of VEGF and its receptors. Nat Med. 2003;9:669–676. - PubMed
-
- Rusnati M, Presta M. Fibroblast growth factors/fibroblast growth factor receptors as targets for the development of anti-angiogenesis strategies. Curr Pharm Des. 2007;13:2025–2044. - PubMed
-
- Tanghetti E, Ria R, Dell'Era P, et al. Biological activity of substrate-bound basic fibroblast growth factor (FGF2): recruitment of FGF receptor-1 in endothelial cell adhesion contacts. Oncogene. 2002;21:3889–3897. - PubMed
-
- Brown MD, Hudlicka O, Damon D, Duling BR. Vasoactive effects of basic and acidic fibroblast growth factors in hamster cheek pouch arterioles. Int J Microcirc Clin Exp. 1996;16:308–312. - PubMed
Publication types
MeSH terms
Substances
Grants and funding
LinkOut - more resources
Full Text Sources
Miscellaneous

