. 2010 Oct;18(10):1769-77.
doi: 10.1038/mt.2010.133. Epub 2010 Jul 6.

The extracellular matrix glycoprotein tenascin-C is beneficial for spinal cord regeneration

Affiliations

The extracellular matrix glycoprotein tenascin-C is beneficial for spinal cord regeneration

Jian Chen et al. Mol Ther. 2010 Oct.

Abstract

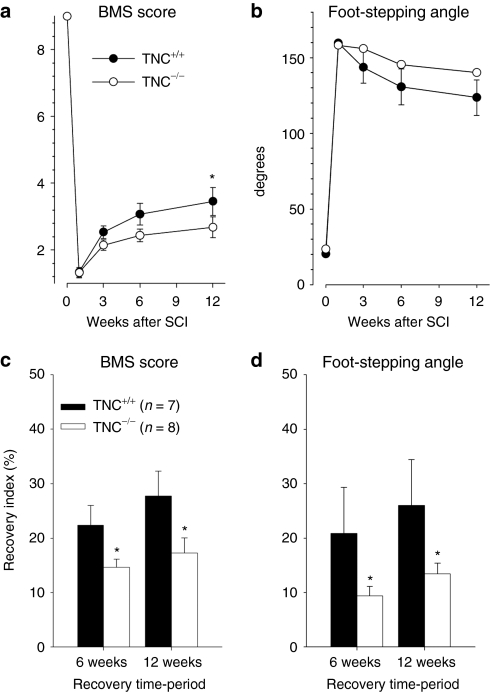
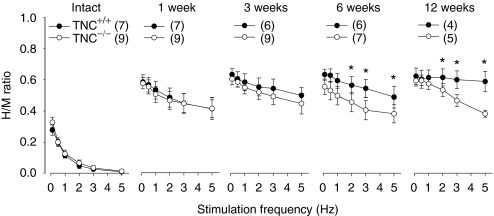
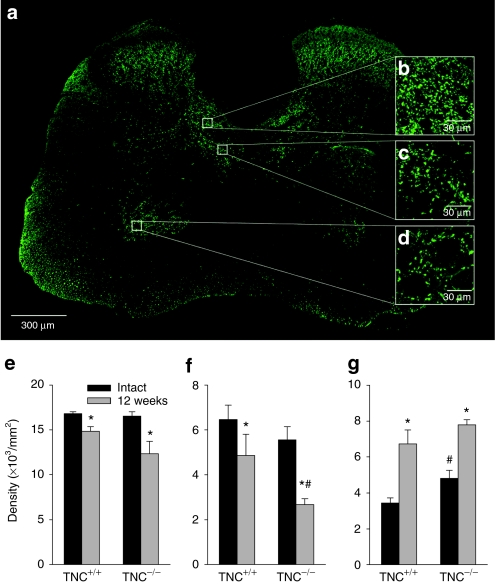
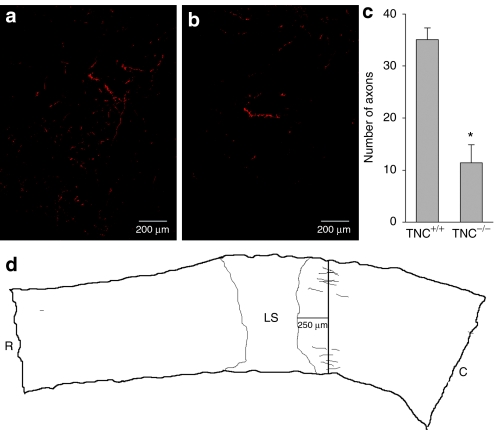
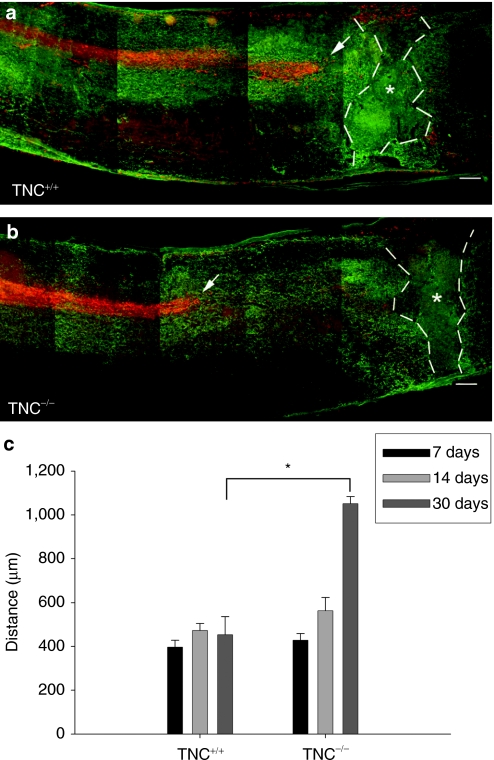
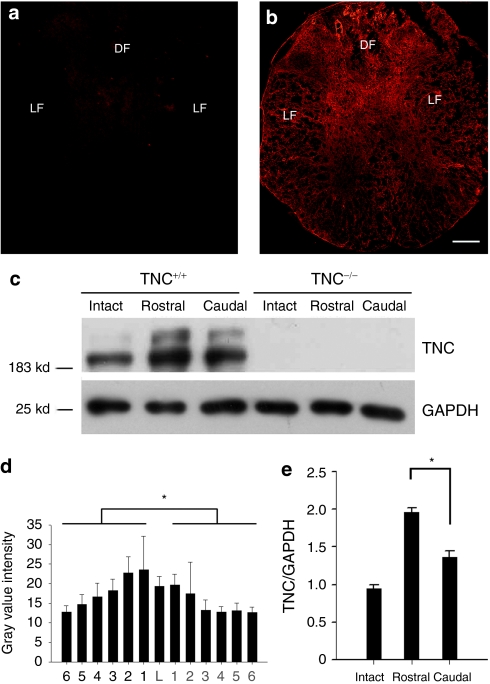
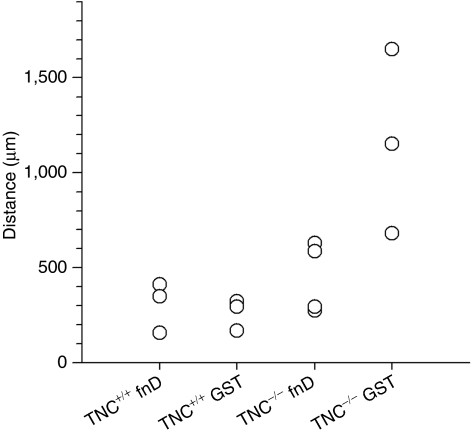
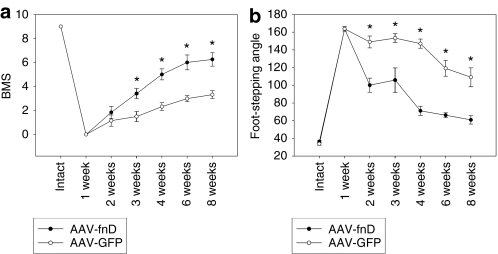
Tenascin-C (TNC), a major component of the extracellular matrix, is strongly upregulated after injuries of the central nervous system (CNS) but its role in tissue repair is not understood. Both regeneration promoting and inhibiting roles of TNC have been proposed considering its abilities to both support and restrict neurite outgrowth in vitro. Here, we show that spontaneous recovery of locomotor functions after spinal cord injury is impaired in adult TNC-deficient (TNC(-/-)) mice in comparison to wild-type (TNC(+/+)) mice. The impaired recovery was associated with attenuated excitability of the plantar Hoffmann reflex (H-reflex), reduced glutamatergic input, reduced sprouting of monaminergic axons in the lumbar spinal cord and enhanced post-traumatic degeneration of corticospinal axons. The degeneration of corticospinal axons in TNC(-/-) mice was normalized to TNC(+/+) levels by application of the alternatively spliced TNC fibronectin type III homologous domain D (fnD). Finally, overexpression of TNC-fnD via adeno-associated virus in wild-type mice improved locomotor recovery, increased monaminergic axons sprouting, and reduced lesion scar volume after spinal cord injury. The functional efficacy of the viral-mediated TNC indicates a potentially useful approach for treatment of spinal cord injury.


Figures

Figure 1
Figure 1
Functional recovery after compression spinal cord injury in TNC–/– and TNC+/+ mice estimated by Basso Mouse Score (BMS) rating and foot-stepping angle. Mean values (±SEM) of (a) BMS scores and (b) foot-stepping angles before surgery (day 0) and at 1, 3, 6, and 12 weeks after injury. Recovery indexes (mean values ± SEM) calculated from individual animal values for (c) BMS score and (d) foot-stepping angle at 6 and 12 weeks after injury. Numbers of animals per group are indicated in c. Asterisks indicate significant differences between group mean values at a given time period (one-way analysis of variance for repeated measurements with Tukey's post hoc test, P < 0.05). TNC, tenascin-C.
Figure 2
Figure 2
Rate depression of the Hoffmann reflex at different time points after spinal cord injury in TNC–/– and TNC+/+ mice. Shown are mean values (±SEM) of H/M ratios at different stimulation frequencies before operation and 1, 3, 6, and 12 weeks after spinal cord injury. At 6 and 12 weeks after injury, the H/M ratios in TNC–/– mice are significantly lower than in TNC+/+ littermates at high frequencies (analysis of variance for repeated measurements with Tukey's post hoc test, *P < 0.05). Number of animals are indicated in parenthesis. TNC, tenascin-C.
Figure 3
Figure 3
Immunohistochemical analysis of VGLUT1+ terminals in the spinal cord of intact and injured TNC–/– and TNC+/+ mice. (a) A representative section of the spinal cord of a TNC+/+ mouse shows the distribution of VGLUT1+ puncta. Digital images of VGLUT1+ terminals in the (b) Clarke's column, (c) medial lamina VII, and (d) lamina IX obtained at high magnification (insets b, c, d) were used for estimation of terminal densities (number of puncta per unit area). Mean densities (±SEM) of terminals in the three areas in injured and intact TNC–/– (n = 5) and TNC+/+ mice (n = 4) are shown in e–g. Six sections 250 µm apart were analyzed per animal. Asterisks indicate differences between noninjured and injured mice of the same genotype, cross-hatches denote differences between intact or injured TNC–/– and TNC+/+ mice (P < 0.05, two-sided t-test for independent samples). TNC, tenascin-C; VGLUT1, vesicular glutamate transporter 1.
Figure 4
Figure 4
Analysis of monaminergic axons in the lumbar spinal cord of TNC–/– and TNC+/+ mice 12 weeks after injury. Representative images of tyrosine hydroxylase-positive (TH+) fibers in (a) TNC+/+ and (b) TNC–/– mice. (c) Mean numbers (±SEM) of TH+ axons in four TNC+/+ and three TNC–/– mice. Every 5th parasagittal serial section from the spinal cord of each animal was analyzed. (d) The axon counting paradigm is illustrated in the Neurolucida drawing. Asterisk indicates significant difference between TNC–/– and TNC+/+ mice (P < 0.05, two-sided t-test for independent samples). C, caudal; LS, lesion site; R, rostral; TNC, tenascin-C.
Figure 5
Figure 5
Corticospinal tract axonal ‘dying-back' is reduced in TNC–/– mice after spinal cord injury. Localization of corticospinal tract axons anterogradely labeled with fluoro-ruby (red) with respect to the center of the lesion (indicated by stars) as seen by immunolabeling of astrocytes by GFAP (green) in consecutive longitudinal sections of a (a) TNC+/+ and (b) TNC–/– mice 30 days after spinal cord injury. Tips of the longest axons of the corticospinal tracts are indicated by arrows. Bar = 100 µm. (c) Mean distances (±SEM) between the tips of the corticospinal tract axons and the lesion center in TNC–/– mice and TNC+/+ mice at 7, 14, and 30 days after injury (n = 4 for each time point). Broken lines indicate extent of the glial scar. Asterisk indicates a significant difference between the genotypes (P < 0.01, t-test). GFAP, glial fibrillary acidic protein; TNC, tenascin-C.
Figure 6
Figure 6
Immunohistochemical and western blot analysis of TNC expression in intact and injured spinal cords 4 days after injury. (a) By immunohistochemistry, TNC is hardly detectable in the intact spinal cord. (b) In the lesioned spinal cords of TNC+/+ mice, 4 days after injury, TNC is upregulated in both gray matter and white matter. (c) Western blot analysis of TNC expression is consistent with the fluorescence intensity evaluation (n = 4 for western blot), with TNC being more predominantly expressed in the spinal cord rostral to the lesion site, less in the spinal cord caudal to the lesion site, and least in the intact spinal cord. Equal loading of protein extracts is seen by western blot analysis of GAPDH. (d) Mean immunofluorescence intensities in consecutive transverse spinal cord sections show higher levels of TNC in the spinal cord rostral than caudal to the lesion site (n = 4 for immunofluorescence, mean values ± SEM are shown). The lesion center is designated as level “L,” and other sequential levels are designated as levels 1, 2, etc. at 600-µm spaced intervals rostrally and caudally from the lesion. (e) Quantitative evaluation of band intensities by western blot analysis of intact spinal cords and segments of injured spinal cords proximal and distal to the lesion site. Asterisk indicates a significant difference between groups (P < 0.01, t-test). Bar = 100 µm. DF, dorsal funiculus; GAPDH, glyceraldehyde-3-phosphate dehydrogenase; LF, lateral funiculus; TNC, tenascin-C.
Figure 7
Figure 7
TNC-derived fusion protein GST-fnD rescues the dying back of corticospinal tract axons in TNC–/– mice but does not promote further regrowth of corticospinal tract axons in TNC+/+ mice. The distance between the tips of the corticospinal tract axons and lesion center was used as index of axonal degeneration after spinal cord injury in individual animals (indicated by circles). Four groups were tested: TNC-derived fusion protein GST-fnD was administered to the spinal cords of TNC+/+ (TNC+/+ fnD, n = 3) and TNC–/– (TNC–/– fnD, n = 4) mice; similarly, GST was administered as control to TNC+/+ (TNC+/+ GST, n = 3) and TNC–/– (TNC–/– GST, n = 3) mice. fnD, fibronectin type III homologous domain D; GST, glutathione S-transferase; TNC, tenascin-C.
Figure 8
Figure 8
AAV-fnD improves locomotor recovery after spinal cord injury. Recovery was evaluated by (a) BMS and (b) foot-stepping angle at 1, 2, 3, 4, 6, and 8 weeks after spinal cord injury and AAV injection. Locomotor recovery in the AAV-fnD group (n = 11) is better than in AAV-GFP group (n = 9). Shown are mean values ± SEM. Asterisk indicates statistical significance (t-test) (*P < 0.05). AAV, adeno-associated virus; BMS, Basso Mouse Scale; fnD, fibronectin type III homologous domain D; GFP, green fluorescent protein.

References

    1. GrandPré T, Nakamura F, Vartanian T., and, Strittmatter SM. Identification of the Nogo inhibitor of axon regeneration as a Reticulon protein. Nature. 2000;403:439–444. - PubMed
    1. McKerracher L, David S, Jackson DL, Kottis V, Dunn RJ., and, Braun PE. Identification of myelin-associated glycoprotein as a major myelin-derived inhibitor of neurite growth. Neuron. 1994;13:805–811. - PubMed
    1. Wang KC, Koprivica V, Kim JA, Sivasankaran R, Guo Y, Neve RL, et al. Oligodendrocyte-myelin glycoprotein is a Nogo receptor ligand that inhibits neurite outgrowth. Nature. 2002;417:941–944. - PubMed
    1. Niclou SP, Franssen EH, Ehlert EM, Taniguchi M., and, Verhaagen J. Meningeal cell-derived semaphorin 3A inhibits neurite outgrowth. Mol Cell Neurosci. 2003;24:902–912. - PubMed
    1. Jones LL, Margolis RU., and, Tuszynski MH. The chondroitin sulfate proteoglycans neurocan, brevican, phosphacan, and versican are differentially regulated following spinal cord injury. Exp Neurol. 2003;182:399–411. - PubMed

Publication types