Patient-specific models of deep brain stimulation: influence of field model complexity on neural activation predictions
- PMID: 20607090
- PMCID: PMC2895675
- DOI: 10.1016/j.brs.2010.01.003
Patient-specific models of deep brain stimulation: influence of field model complexity on neural activation predictions
Abstract
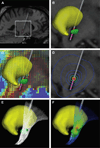
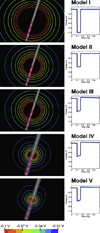
Deep brain stimulation (DBS) of the subthalamic nucleus (STN) has become the surgical therapy of choice for medically intractable Parkinson's disease. However, quantitative understanding of the interaction between the electric field generated by DBS and the underlying neural tissue is limited. Recently, computational models of varying levels of complexity have been used to study the neural response to DBS. The goal of this study was to evaluate the quantitative impact of incrementally incorporating increasing levels of complexity into computer models of STN DBS. Our analysis focused on the direct activation of experimentally measureable fiber pathways within the internal capsule (IC). Our model system was customized to an STN DBS patient and stimulation thresholds for activation of IC axons were calculated with electric field models that ranged from an electrostatic, homogenous, isotropic model to one that explicitly incorporated the voltage-drop and capacitance of the electrode-electrolyte interface, tissue encapsulation of the electrode, and diffusion-tensor based 3D tissue anisotropy and inhomogeneity. The model predictions were compared to experimental IC activation defined from electromyographic (EMG) recordings from eight different muscle groups in the contralateral arm and leg of the STN DBS patient. Coupled evaluation of the model and experimental data showed that the most realistic predictions of axonal thresholds were achieved with the most detailed model. Furthermore, the more simplistic neurostimulation models substantially overestimated the spatial extent of neural activation.
Keywords: Parkinson's disease; computational modeling; deep brain stimulation; neural activation.
Conflict of interest statement
CCM and CRB authored intellectual properties related to the project methodology, and are shareholders in Intelect Medical Inc. CCM, CRB, and AC are paid consultants for Intelect Medical Inc.
Figures


References
-
- DeLong MR, Wichmann T. Circuits and circuit disorders of the basal ganglia. Arch Neurol. 2007;64:20–24. - PubMed
-
- Rivlin-Etzion M, Marmor O, Heimer G, et al. Basal ganglia oscillations and pathophysiology of movement disorders. Curr Opin Neurobiol. 2006;16:629–637. - PubMed
-
- Deuschl G, Schade-Brittinger C, Krack P, et al. A randomized trial of deep-brain stimulation for Parkinson's disease. N Engl J Med. 2006;355:896–908. - PubMed
-
- Obeso JA, Olanow CW, Rodriguez-Oroz MC, et al. Deep-brain stimulation of the subthalamic nucleus or the pars interna of the globus pallidus in Parkinson's disease. N Engl J Med. 2001;345:956–963. - PubMed
-
- Lozano AM, Dostrovsky J, Chen R, Ashby P. Deep brain stimulation for Parkinson's disease: disrupting the disruption. Lancet Neurol. 2002;1:225–231. - PubMed
Publication types
MeSH terms
Grants and funding
LinkOut - more resources
Full Text Sources
Other Literature Sources

