. 2010 Aug 15;58(11):1320-34.
doi: 10.1002/glia.21010.

ApoD, a glia-derived apolipoprotein, is required for peripheral nerve functional integrity and a timely response to injury

Affiliations

ApoD, a glia-derived apolipoprotein, is required for peripheral nerve functional integrity and a timely response to injury

Maria D Ganfornina et al. Glia. .

Abstract

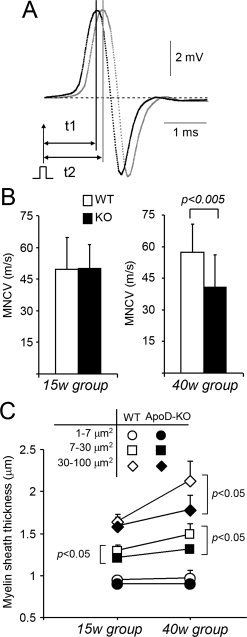
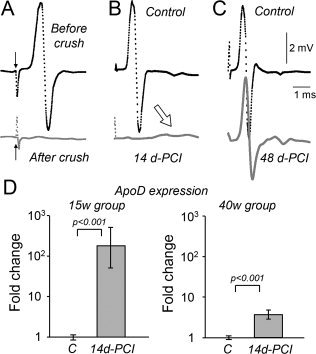
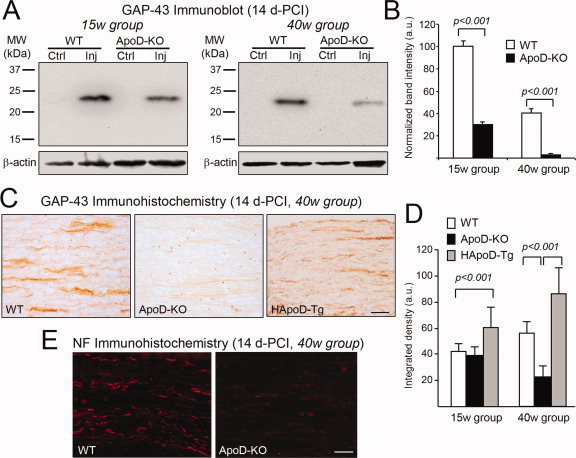
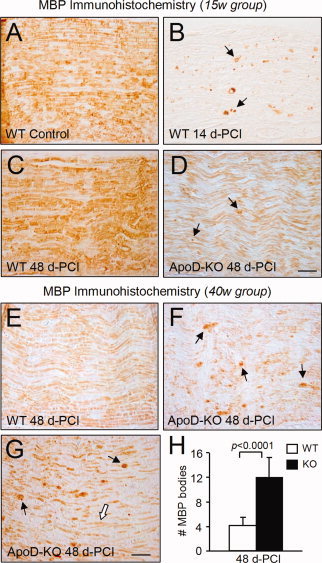
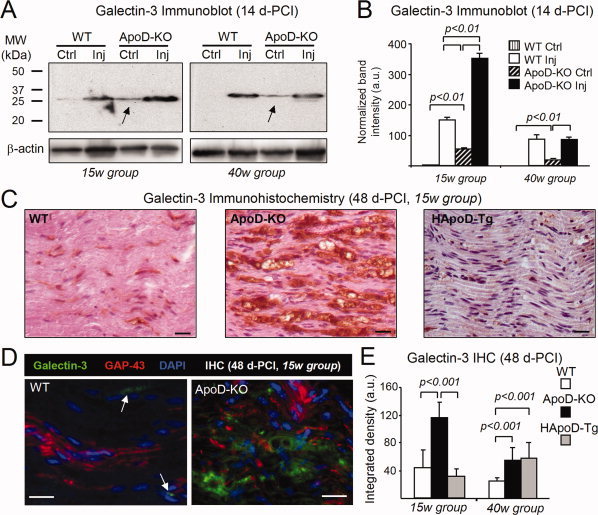
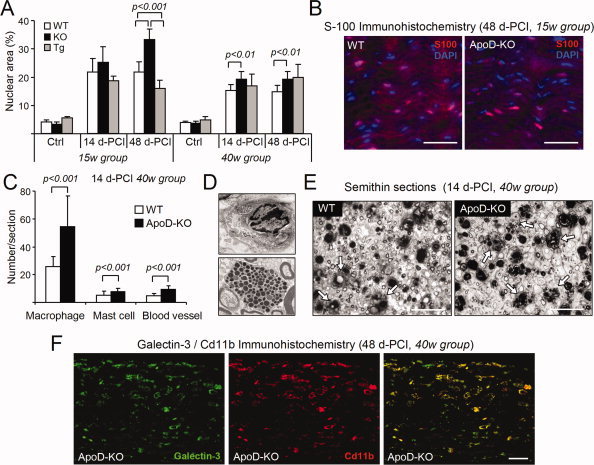
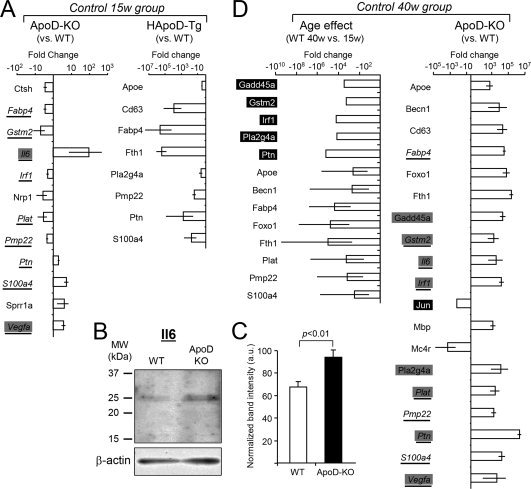
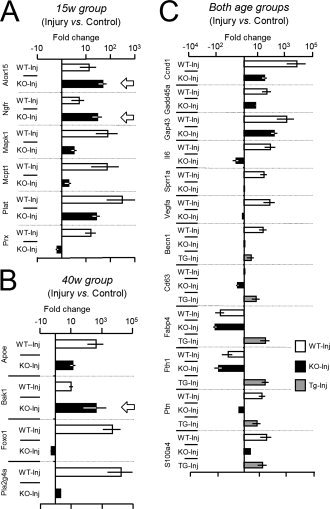
Glial cells are a key element to the process of axonal regeneration, either promoting or inhibiting axonal growth. The study of glial derived factors induced by injury is important to understand the processes that allow or preclude regeneration, and can explain why the PNS has a remarkable ability to regenerate, while the CNS does not. In this work we focus on Apolipoprotein D (ApoD), a Lipocalin expressed by glial cells in the PNS and CNS. ApoD expression is strongly induced upon PNS injury, but its role has not been elucidated. Here we show that ApoD is required for: (1) the maintenance of peripheral nerve function and tissue homeostasis with age, and (2) an adequate and timely response to injury. We study crushed sciatic nerves at two ages using ApoD knock-out and transgenic mice over-expressing human ApoD. The lack of ApoD decreases motor nerve conduction velocity and the thickness of myelin sheath in intact nerves. Following injury, we analyze the functional recovery, the cellular processes, and the protein and mRNA expression profiles of a group of injury-induced genes. ApoD helps to recover locomotor function after injury, promoting myelin clearance, and regulating the extent of angiogenesis and the number of macrophages recruited to the injury site. Axon regeneration and remyelination are delayed without ApoD and stimulated by excess ApoD. The mRNA and protein expression profiles reveal that ApoD is functionally connected in an age-dependent manner to specific molecular programs triggered by injury.


Figures

Figure 1
Figure 1
ApoD influences the myelin of intact sciatic nerves. A: Representative recordings of CMAP evoked by electrical stimulation with two bipolar electrodes. Time differences from stimulus to CMAP peak were used to estimate conduction velocity. B: MNCV from WT and ApoD‐KO mice at two ages. Conduction velocity is compromised in 40‐week‐old ApoD‐KO mice. Data shown as mean ± SEM; n = 10 recordings/mice; 13 mice/age group/genotype. C: Morphometric analysis of myelin sheath thickness in intact myelinated axons (15 weeks and 40 weeks, WT and ApoD‐KO nerves). Statistical differences assayed by Student's t‐test.
Figure 2
Figure 2
Validation of the crush injury method to study ApoD function in WDR. A: Crush effect validation through CMAP recording. CMAP disappears completely after crush. Arrows point to the stimulus artifact. B, C: Recovery of nerve conduction evaluated 14 and 48 d‐PCI. Full recovery of CMAP is achieved at 48 d‐PCI. The small deflections observed at 14 d‐PCI (arrow) are the first signs of recuperation of nerve conduction. D: qRT‐PCR levels of ApoD in intact (C = control nerves) and in the distal region of crushed nerves at 14 d‐PCI (15‐week and 40‐week mice). ApoD is up‐regulated with injury. Statistical differences assayed by Mann‐Whitney's U‐test.
Figure 3
Figure 3
ApoD influences the expression of the regeneration marker GAP‐43 after CI. A: Immunoblot analysis of GAP‐43 in the region distal to the lesion of WT and ApoD‐KO mice at 14d‐PCI (two age groups, pooled samples, n = 6/group/genotype). Ctrl, intact nerve; Inj, injured nerve. B: Protein levels quantified by band densitometry and normalized to β‐actin signal. GAP‐43 expression decrease 69% (15‐week group) and 90% (40‐week group) in ApoD‐KO mice compared with WT nerves. C: Representative photomicrographs of GAP‐43 immunohistochemistry in sagittal sections of the lesion region at 14 d‐PCI (40‐week age group). D: Quantification of GAP‐43 immunoreactivity in the site of lesion at 14 d‐PCI (n = 4/group/genotype). Data shown as mean ± SD. Statistical differences assayed by Student's t‐test. E: 70kD neurofilament marker (2F11) immunofluorescence in sagittal sections of the lesion region at 14 d‐PCI (40‐week age group). Calibration bars in C,E: 50 μm.
Figure 4
Figure 4
The expression of ApoD alters the duration of the myelin debris clearance phase. A–G: Representative examples of MBP immunohistochemistry in sagittal sections of the lesion region (two age groups, n = 4/group/genotype). Arrows point at MBP‐positive myelin bodies. The white arrow in G points to remyelinated axons in ApoD‐KO nerves. Calibration bars: 50 μm. H: Number of MBP‐positive myelin bodies present at 48 d‐PCI in the lesion region of WT and ApoD‐KO (40‐week age group). Statistical differences assayed by Student's t‐test.
Figure 5
Figure 5
ApoD alters the timing and extent of Galectin‐3 expression in injured and intact nerves. A: Immunoblot analysis of Galectin‐3 in the region distal to the lesion of WT and ApoD‐KO mice at 14d‐PCI (two age groups, pooled samples, n = 6/group/genotype). Ctrl, intact nerve; Inj, injured nerve. B: Protein levels quantified by band densitometry normalized to β‐actin signal. In contrast to the almost null expression in WT, ApoD‐KO intact nerves show basal expression of Galectin‐3 at both ages (arrows in A). Upon injury, Galectin‐3 levels are 2.3 times higher in ApoD‐KO than in WT nerves at 15 weeks. Similar amounts are observed at 40 weeks. C: Representative photomicrographs of Galectin‐3 immunohistochemistry in sagittal sections of the lesion region (15‐week mice, 48 d‐PCI). D: Double labeling with anti‐Galectin‐3 and anti‐GAP‐43 antibodies. Scale bars in C,D: 20 μm. E: Quantification of Galectin‐3 immunoreactivity in the site of lesion at 48 d‐PCI (two age groups, n = 4/group/genotype). Data shown as mean ± SD. Statistical differences assayed by Student's t‐test.
Figure 6
Figure 6
Effect of ApoD on the recruitment and persistence of cells at the injury site. A: Cellularization index (% area occupied by nuclei) in the lesion region of intact (Ctrl) and crushed nerves at two time points after crush (two age groups, n = 4/group/genotype). B: Representative examples of S100‐positive cells in the lesion region of WT and ApoD‐KO crushed nerves (15‐week mice, 48 d‐PCI). C: Number of macrophages, mast cells, and blood vessels in semithin cross‐sections of the lesion region of WT and ApoD‐KO crushed nerves. D: Examples of macrophage (top) and mast cell (bottom). E: Representative micrographs of semithin cross‐sections of the lesion regions of WT and ApoD‐KO nerves (40 week mice, 14 d‐PCI). Arrows point to macrophages engulfing myelin debris. F: Representative micrographs of CD11b and Galectin‐3 double immunofluorescence in sagittal sections of the lesion region (40 week mice, 48 d‐PCI). Merged images are shown in the third panel. Calibration bars: 50 μm in B,F; 30 μm in E. Statistical differences assayed by Student's t‐test in A,C.
Figure 7
Figure 7
Quantitative RT‐PCR expression profiles of intact nerves of different genotypes and age groups. A: Profile of genes that change their expression in intact 15 weeks nerves of ApoD‐KO and HApoD‐Tg mice. WT intact nerve expression is used as the calibrator for each gene (n = 6/group). B, C: Immunoblot analysis of Il6 in total protein preparations of 33 weeks old intact WT and ApoD‐KO nerves. Protein levels were quantified by band densitometry normalized to β‐actin signal. Il6 expression shows a 1.4 fold increase in ApoD‐KO nerves with respect to WT. D: Gene profiles in 40‐week‐old intact nerves. Left graph shows the age effect in the profile of WT gene expression (WT 40‐week and 15‐week nerves are compared). Right graph shows the gene profile of 40‐week intact nerves from ApoD‐KO mice using the 40‐week WT intact nerve as calibrator. Gray and black boxes point to genes turned on and off respectively. Underlined genes are ApoD‐dependent in both age groups. n = 8/group. Only statistically supported changes (Mann‐Whitney's U‐test) with Log 2−ΔΔCt ≥ ±0.3 (twofold increase) are shown.
Figure 8
Figure 8
Effects of injury at 14 d‐PCI in the gene expression profile of nerves with different genotype and age. Expression was assayed by quantitative RT‐PCR using the intact nerve expression level as calibrator for each gene and genotype. A, B: Profiles of ApoD‐dependent genes at 15 week (A) and 40 week (B). C: Injury‐regulated genes with similar patterns of ApoD‐dependence at both ages. Arrows point to genes that show an increased up‐regulation with injury (compared to WT) in the absence of ApoD. n = 6/group. A threshold of Log 2−ΔΔCt ≥±0.3 (twofold increase) was used. Only genes in which the response to injury was statistically different between genotypes (Mann‐Whitney's U‐test) are shown.

References

    1. Al‐Shahrour F,Minguez P,Tarraga J,Medina I,Alloza E,Montaner D,Dopazo J. 2007. FatiGO +: A functional profiling tool for genomic data. Integration of functional annotation, regulatory motifs and interaction data with microarray experiments. Nucleic Acids Res 35(Web Server issue): W91–W96. - PMC - PubMed
    1. Balboa MA,Balsinde J. 2006. Oxidative stress and arachidonic acid mobilization. Biochim Biophys Acta 1761: 385–391. - PubMed
    1. Bosse F,Hasenpusch‐Theil K,Kury P,Muller HW. 2006. Gene expression profiling reveals that peripheral nerve regeneration is a consequence of both novel injury‐dependent and reactivated developmental processes. J Neurochem 96: 1441–1457. - PubMed
    1. Boyles JK,Notterpek LM,Anderson LJ. 1990. Accumulation of apolipoproteins in the regenerating and remyelinating mammalian peripheral nerve. Identification of apolipoprotein D, apolipoprotein A‐IV, apolipoprotein E, apolipoprotein A‐I. J Biol Chem 265: 17805–17815. - PubMed
    1. Cavaggioni A,Pelosi P,Edwards S,Sawyer L. 2006. Functional aspects of β‐lactoglobulin, major urinary protein and odorant binding protein. In: Akerstrom B,Borregaard N,Flower D,Salier J, editors. Lipocalins. Georgetown, Texas: Landes Bioscience. pp 131–139.

Publication types

MeSH terms