

Three measures of longevity: time trends and record values
- PMID: 20608098
- PMCID: PMC3000019
- DOI: 10.1353/dem.0.0098
Three measures of longevity: time trends and record values
Abstract
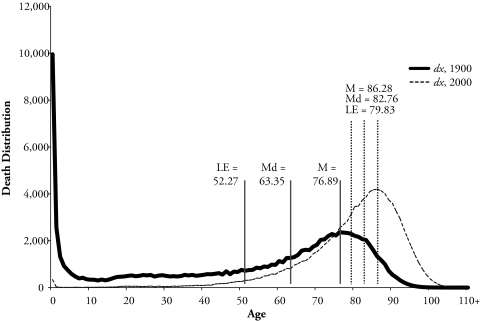
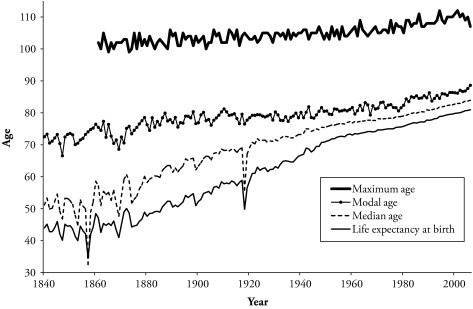
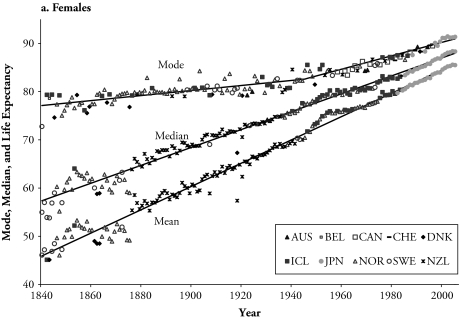
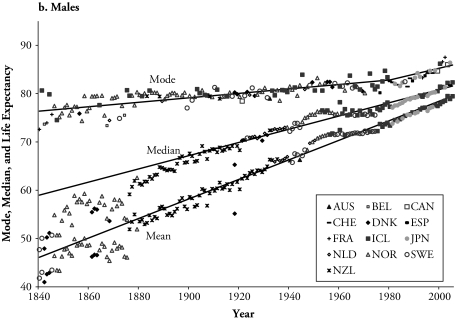
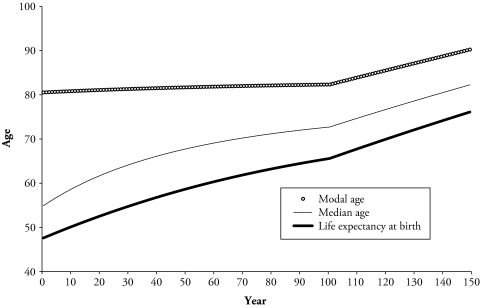
This article examines the trend over time in the measures of "typical" longevity experienced by members of a population: life expectancy at birth, and the median and modal ages at death. The article also analyzes trends in record values observed for all three measures. The record life expectancy at birth increased from a level of 44 years in Sweden in 1840 to 82 years in Japan in 2005. The record median age at death shows increasing patterns similar to those observed in life expectancy at birth. However, the record modal age at death changes very little until the second half of the twentieth century: it moved from a plateau level, around age 80, to having a similar pace of increase as that observed for the mean and the median in most recent years. These findings explain the previously observed uninterrupted increase in the record life expectancy. The cause of this increase has changed over time from a dominance of child mortality reductions to a dominance of adult mortality reductions, which became evident by studying trends in the record modal age at death.
Figures
References
-
- Bongaarts J. “Long-Range Trends in Adult Mortality: Models and Projection Methods”. Demography. 2005;42:23–49. - PubMed
-
- Bongaarts J. “How Long Will We Live?”. Population and Development Review. 2006;32:605–28.
-
- Canudas-Romo V. Decomposition Methods in Demography. Amsterdam: Rozenberg Publishers; 2003.
-
- Canudas-Romo V. “The Modal Age at Death and the Shifting Mortality Hypothesis”. Demographic Research. 2008;19:1179–204.
-
- Canudas-Romo V, Schoen R. “Age-Specific Contributions to Changes in the Period and Cohort Life Expectancy”. Demographic Research. 2005;13:63–82.
Publication types
MeSH terms
Grants and funding
LinkOut - more resources
Full Text Sources
Other Literature Sources
