Ethanol alters the osteogenic differentiation of amniotic fluid-derived stem cells
- PMID: 20608908
- PMCID: PMC2950880
- DOI: 10.1111/j.1530-0277.2010.01258.x
Ethanol alters the osteogenic differentiation of amniotic fluid-derived stem cells
Abstract
Background: Fetal alcohol spectrum disorder (FASD) is a set of developmental defects caused by prenatal alcohol exposure. Clinical manifestations of FASD are highly variable and include mental retardation and developmental defects of the heart, kidney, muscle, skeleton, and craniofacial structures. Specific effects of ethanol on fetal cells include induction of apoptosis as well as inhibition of proliferation, differentiation, and migration. This complex set of responses suggests that a bioinformatics approach could clarify some of the pathways involved in these responses.
Methods: In this study, the responses of fetal stem cells derived from the amniotic fluid (AFSCs) to treatment with ethanol have been examined. Large-scale transcriptome analysis of ethanol-treated AFSCs indicates that genes involved in skeletal development and ossification are up-regulated in these cells. Therefore, the effect of ethanol on osteogenic differentiation of AFSCs was studied.
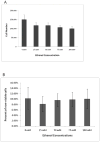
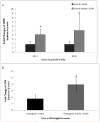
Results: Exposure to ethanol during the first 48 hours of an osteogenic differentiation protocol increased in vitro calcium deposition by AFSCs and increased alkaline phosphatase activity. In contrast, ethanol treatment later in the differentiation protocol (day 8) had no significant effect on the activity of alkaline phosphatase.
Conclusions: These results suggest that transient exposure of AFSCs to ethanol during early differentiation enhances osteogenic differentiation of the cells.
Copyright © 2010 by the Research Society on Alcoholism.
Figures


Similar articles
-
Inhibitory effect of alcohol on osteogenic differentiation in human bone marrow-derived mesenchymal stem cells.Alcohol Clin Exp Res. 2004 Mar;28(3):468-79. doi: 10.1097/01.alc.0000118315.58404.c1. Alcohol Clin Exp Res. 2004. PMID: 15084905
-
Bilayered constructs aimed at osteochondral strategies: the influence of medium supplements in the osteogenic and chondrogenic differentiation of amniotic fluid-derived stem cells.Acta Biomater. 2012 Jul;8(7):2795-806. doi: 10.1016/j.actbio.2012.04.013. Epub 2012 Apr 14. Acta Biomater. 2012. PMID: 22510402
-
Osteoblast differentiation of amniotic fluid-derived stem cells irradiated with visible light.Tissue Eng Part A. 2011 Nov;17(21-22):2593-602. doi: 10.1089/ten.tea.2011.0080. Epub 2011 Jul 20. Tissue Eng Part A. 2011. PMID: 21774692
-
Amniotic fluid-derived mesenchymal stem cells lead to bone differentiation when cocultured with dental pulp stem cells.Tissue Eng Part A. 2011 Mar;17(5-6):645-53. doi: 10.1089/ten.TEA.2010.0340. Epub 2010 Nov 22. Tissue Eng Part A. 2011. PMID: 20919950
-
Effects of naringin on the proliferation and osteogenic differentiation of human amniotic fluid-derived stem cells.J Tissue Eng Regen Med. 2017 Jan;11(1):276-284. doi: 10.1002/term.1911. Epub 2014 Jun 11. J Tissue Eng Regen Med. 2017. PMID: 24915843
Cited by
-
Alcohol-induced epigenetic alterations to developmentally crucial genes regulating neural stemness and differentiation.Alcohol Clin Exp Res. 2013 Jul;37(7):1111-22. doi: 10.1111/acer.12080. Epub 2013 Mar 12. Alcohol Clin Exp Res. 2013. PMID: 23488822 Free PMC article.
-
Influence of Chronic Alcohol Use on Osteoblastic Differentiation of Bone Marrow Cells, Bone Properties, and Hepatic and Renal Morphology of Rats.ScientificWorldJournal. 2018 Jul 2;2018:2494918. doi: 10.1155/2018/2494918. eCollection 2018. ScientificWorldJournal. 2018. PMID: 30057490 Free PMC article.
-
Correlating Dose and Time of Prenatal Alcohol, Smoking, and Drug Exposure on Craniofacial Morphology: A Systematic Review.Cureus. 2025 Feb 1;17(2):e78320. doi: 10.7759/cureus.78320. eCollection 2025 Feb. Cureus. 2025. PMID: 40034638 Free PMC article. Review.
-
Molecular consequences of fetal alcohol exposure on amniotic exosomal miRNAs with functional implications for stem cell potency and differentiation.PLoS One. 2020 Nov 16;15(11):e0242276. doi: 10.1371/journal.pone.0242276. eCollection 2020. PLoS One. 2020. PMID: 33196678 Free PMC article.
References
-
- Adachi J, Mizoi Y, Fukunaga T, Ogawa Y, Ueno Y, Imamichi H. Degrees of alcohol intoxication in 117 hospitalized cases. J Stud Alcohol. 1991;52:448–453. - PubMed
-
- Astley SJ, Clarren SK. Diagnosing the full spectrum of fetal alcohol-exposed individuals: introducing the 4-digit diagnostic code. Alcohol Alcohol. 2000;35:400–410. - PubMed
-
- Becker HC, az-Granados JL, Randall CL. Teratogenic actions of ethanol in the mouse: a minireview. Pharmacol Biochem Behav. 1996;55:501–513. - PubMed
-
- Bellows CG, Aubin JE, Heersche JN. Initiation and progression of mineralization of bone nodules formed in vitro: the role of alkaline phosphatase and organic phosphate. Bone Miner. 1991;14:27–40. - PubMed
Publication types
MeSH terms
Substances
Grants and funding
LinkOut - more resources
Full Text Sources
Molecular Biology Databases

