. 2010 Nov;20(6):1077-89.
doi: 10.1111/j.1750-3639.2010.00414.x. Epub 2010 Jul 4.

Proteomic profiling of the epileptic dentate gyrus

Affiliations

Proteomic profiling of the epileptic dentate gyrus

Aiqing Li et al. Brain Pathol. 2010 Nov.

Abstract

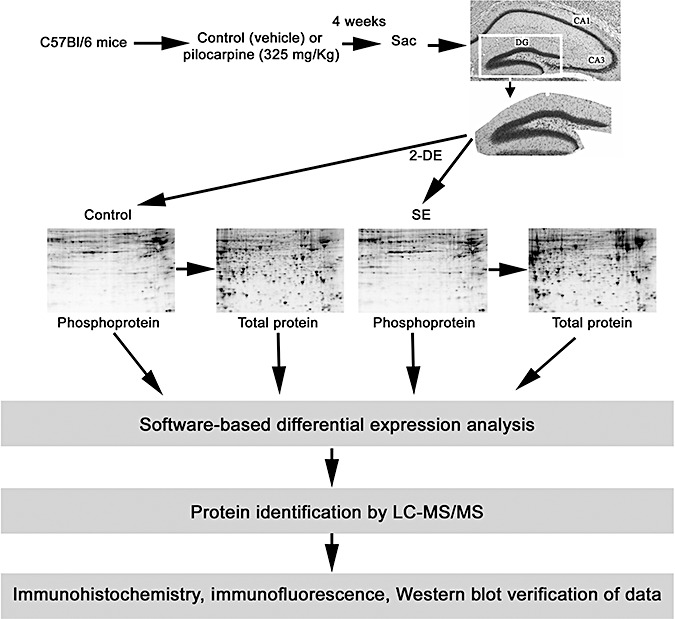
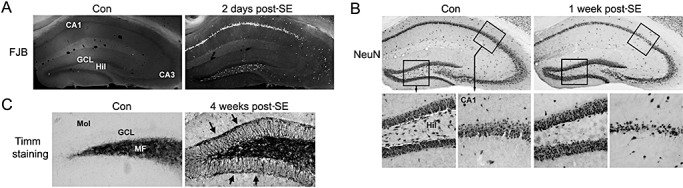
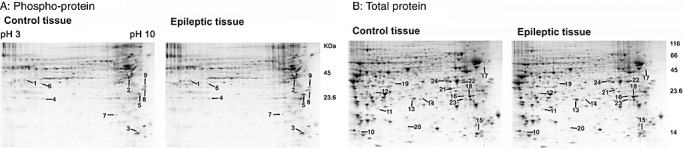
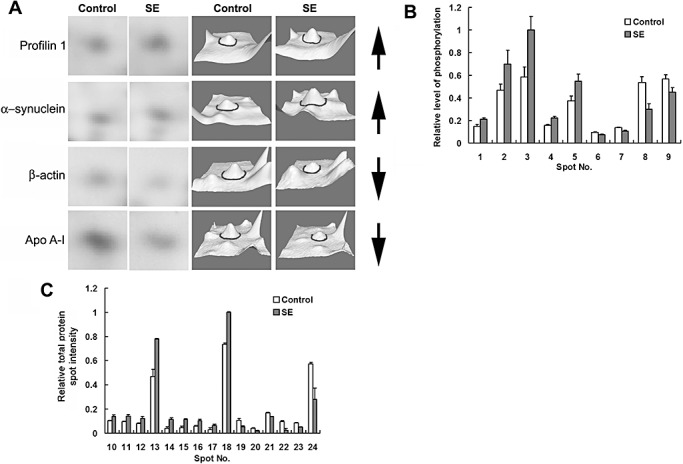
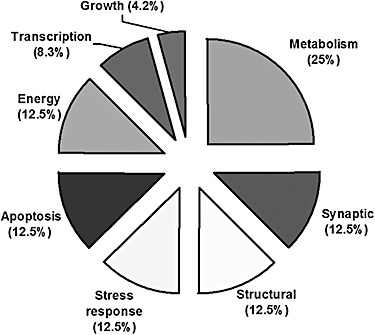
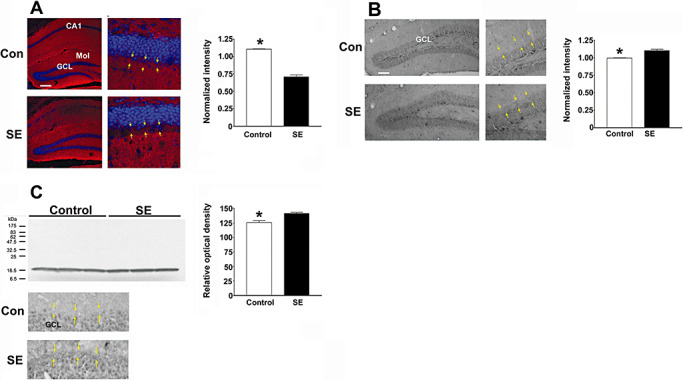
The development of epilepsy is often associated with marked changes in central nervous system cell structure and function. Along these lines, reactive gliosis and granule cell axonal sprouting within the dentate gyrus of the hippocampus are commonly observed in individuals with temporal lobe epilepsy (TLE). Here we used the pilocarpine model of TLE in mice to screen the proteome and phosphoproteome of the dentate gyrus to identify molecular events that are altered as part of the pathogenic process. Using a two-dimensional gel electrophoresis-based approach, followed by liquid chromatography-tandem mass spectrometry, 24 differentially expressed proteins, including 9 phosphoproteins, were identified. Functionally, these proteins were organized into several classes, including synaptic physiology, cell structure, cell stress, metabolism and energetics. The altered expression of three proteins involved in synaptic physiology, actin, profilin 1 and α-synuclein was validated by secondary methods. Interestingly, marked changes in protein expression were detected in the supragranular cell region, an area where robust mossy fibers sprouting occurs. Together, these data provide new molecular insights into the altered protein profile of the epileptogenic dentate gyrus and point to potential pathophysiologic mechanisms underlying epileptogenesis.


Figures

Figure 3
Figure 3
Schematic overview of the epileptogenesis paradigm and the tissue isolation and protein profiling methods. The isolated dentate gyrus (DG) was subjected to 2‐D electrophoresis and all gels were sequentially stained with Pro‐Q DPS, SYPRO Ruby and Coomassie Blue dye. PDQuest software was used to match spots and analyze expression patterns. Selected protein spots were identified by LC‐MS/MS and verified using immunohistochemical and Western blotting approaches. The representative brain section was stained with cresyl violet: CA3 and CA1 cell layers are noted.
Figure 1
Figure 1
Electroencephalogram (EEG) recording from the CA1 area of the hippocampus. A. Representative EEG trace prior to the injection of pilocarpine (325 mg/kg: top trace) and 10 min, 2 h and 24 h following the onset of status epilepticus (SE). High‐voltage spike discharges can be observed at the 10 minutes and 2 h post‐SE time points; frequent lower amplitude discharges were observed at the 24 h time point. B. Representative EEG trace showing spontaneous epileptiform activity 4 weeks after pilocarpine‐evoked SE. Boxed regions (b1–b3) are presented on an expanded time scale.
Figure 2
Figure 2
Hippocampal cell death and synaptic modification. A. Animals were sacrificed 2 days after injection with pilocarpine [2 days post status epilepticus (SE)] or saline (Con) and cell death was examined via Fluoro‐Jade B (FJB) staining. Coronal brain sections through the dorsal hippocampus revealed marked cell death within the CA1 and hilar (Hil) regions of the dentate gyrus. Limited cell death was observed in the CA3 region. Cell death was not detected in granule cell layer (GCL), nor was it detected in any hippocampal region in the control, saline‐injected, animal. MF = mossy fibers. B. Immunohistochemical staining against NeuN indicates marked loss of hippocampal CA1 neurons and hilar neurons. Mice were sacrificed 1 week post SE. C. At 4 weeks post SE, mossy fiber sprouting from the GCL was examined via Timm staining. Compared to control, saline‐injected mice, SE triggered marked synaptic outgrowth into the inner molecular layer (Mol). Arrows denote the molecular layer/GCL border (here referred to as the supragranular region).
Figure 4
Figure 4
2‐DE analysis of the dentate gyrus. Representative gels from control tissue and from epileptic tissue [4 weeks post status epilepticus (SE)]. Gels were initially stained for phosphoproteins via Pro‐Q DPS (A) and then for total proteins via SYPRO ruby (B). Spots with significant changes (control vs. SE) in the phosphorylation level or total protein content were given a numerical label (noted), then isolated and sequenced. The annotated data set is presented in Table 1.
Figure 5
Figure 5
Comparative analysis of phosphoprotein and total protein levels. A. A subset of sequenced protein spots is presented in an expanded 2‐D gel view and as 3‐D surface renderings. Proteins spots of interest are centered in each panel and denoted by an encompassing circle in the renderings. Apo AI = Apolipoprotein A‐I. Arrows to the right of each row indicate whether the expression increased or decreased. B. Histograph of the relative intensity [control vs. status epilepticus (SE)] of phosphoprotein spots that exhibited significant (P < 0.05, ANOVA test) alterations in phosphorylation levels. Spot intensity values were normalized to the highest intensity spot (#3: SE), which was standardized to a value of 1. C. Histograph of the relative intensity (control vs. SE) of protein spots that exhibited a significant (P < 0.05, ANONA test) alteration in expression. Spot intensity values were normalized to the highest intensity spot (#18: SE), which was standardized to a value of 1. Data were averaged from quadruplicate determinations. Error bars denote the SEM.
Figure 6
Figure 6
Functional classification of proteins that exhibited a significant change in expression or phosphorylation levels in the epileptic dentate gyrus (N= 24).
Figure 7
Figure 7
Protein validation. A. Status epilepticus (SE) causes depolymerization of F‐actin. Tissue was processed for polymerized actin via rhodamine‐phalloidin labeling (red) and for cellular nuclei with DraQ labeling (pseudocolored blue). Representative images of the dorsal hippocampus reveal a marked decreased in actin polymerization within the supragranule region of the dentate gyrus of the epileptic mouse (denoted SE). Yellow arrows in both the control and SE tissue denote the inner and outer boarders of the supragranule region. GCL = granule cell layer; Mol = molecular cell layer. Summarized data (right panel) showing the ratio of F‐actin labeling intensity in the supragranule layer vs. labeling within the outer molecular layer. The relative intensity of F‐actin was ∼30% lower in the supragranular region from mice sacrificed at 4 weeks post SE. **P < 0.001 by two‐tailed Student's t‐test. Error bars denote SEM. Scale bar: 100 µm. B. Representative immunohistochemical labeling for profilin 1. In control animals, profilin 1 expression is detected in the GCL; in mice rendered epileptic, increased profilin 1 expression is also visible within the supragranule cell region. Yellow arrows in both the control and SE animals denote the inner and outer boarders of the supragranule region. Quantitative analysis of profilin 1 expression in the supragranule region is shown to the right. Relative to control mice, the intensity of profilin 1 was elevated (∼11%) in mice sacrificed 4 weeks post SE. **P < 0.001 by two‐tailed Student's t‐test. Quantification was performed by determining the ratio of profilin 1 expression in the supragranular region to profilin 1 expression in the outer molecular cell layer. Error bars denote SEM Scale bar: 100 µm. C. Top. Western blot analysis of α‐synuclein expression in the dentate gyrus. Samples were prepared from three independent samples for each condition. Band density was digitized, and mean ± SEM optical density is presented in the panel to the right. * denotes a significant increase in α‐synuclein expression *P < 0.05. Error bars denote SEM. Please see the Methods section for a detailed description of the quantitation methods. C. Bottom. Representative immunohistochemical labeling for α‐synuclein. Relative to the control tissue (top) elevated α‐synuclein expression was observed within the supragranule regions of the mouse sacrificed 4 weeks post SE. Yellow arrows in both the control and SE animals denote the inner and outer boarders of the supragranule region.

Similar articles

Cited by

References

    1. Abeliovich A, Schmitz Y, Farinas I, Choi‐Lundberg D, Ho WH, Castillo PE et al (2000) Mice lacking alpha‐synuclein display functional deficits in the nigrostriatal dopamine system. Neuron 25:239–252. - PubMed
    1. Akbar MT, Lundberg AM, Liu K, Vidyadaran S, Wells KE, Dolatshad H et al (2003) The neuroprotective effects of heat shock protein 27 overexpression in transgenic animals against kainate‐induced seizures and hippocampal cell death. J Biol Chem 278:19956–19965. - PubMed
    1. Anderson RE, Engstrom FL, Woodbury DM (1984) Localization of carbonic anhydrase in the cerebrum and cerebellum of normal and audiogenic seizure mice. Ann N Y Acad Sci 429:502–504. - PubMed
    1. Benes P, Vetvicka V, Fusek M (2008) Cathepsin D—many functions of one aspartic protease. Crit Rev Oncol Hematol 68:12–28. - PMC - PubMed
    1. Birbach A (2008) Profilin, a multi‐modal regulator of neuronal plasticity. Bioessays 30:994–1002. - PubMed

Publication types

MeSH terms