. 2010 Jul;32(1):29-40.
doi: 10.1111/j.1460-9568.2010.07281.x.

Sensory and cortical activation of distinct glial cell subtypes in the somatosensory thalamus of young rats

Affiliations
Free PMC article

Sensory and cortical activation of distinct glial cell subtypes in the somatosensory thalamus of young rats

H Rheinallt Parri et al. Eur J Neurosci. 2010 Jul.
Free PMC article

Abstract

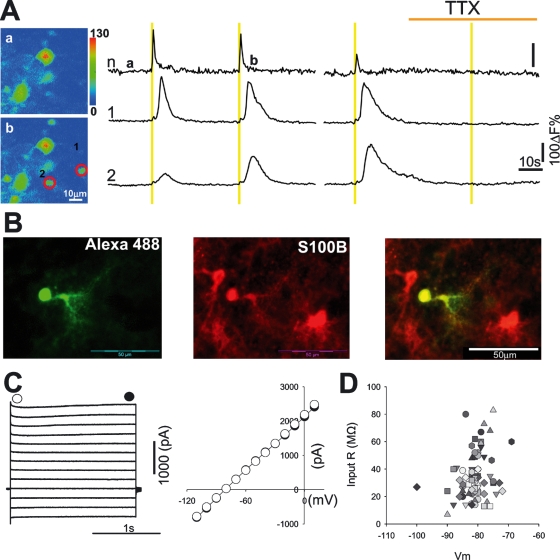
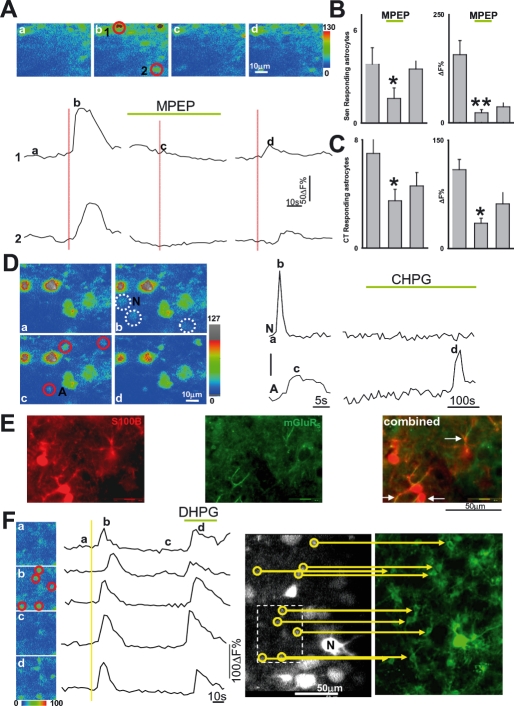
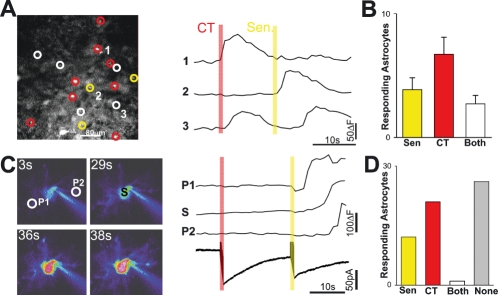
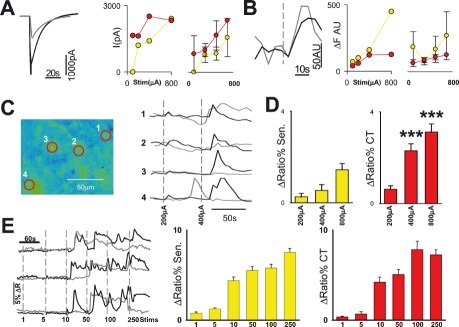
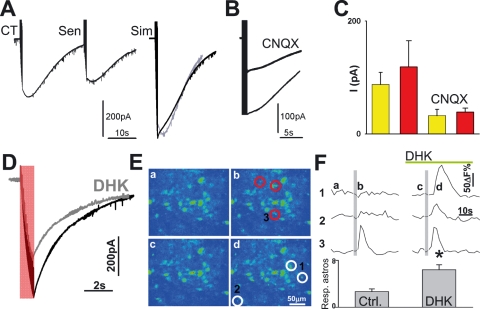
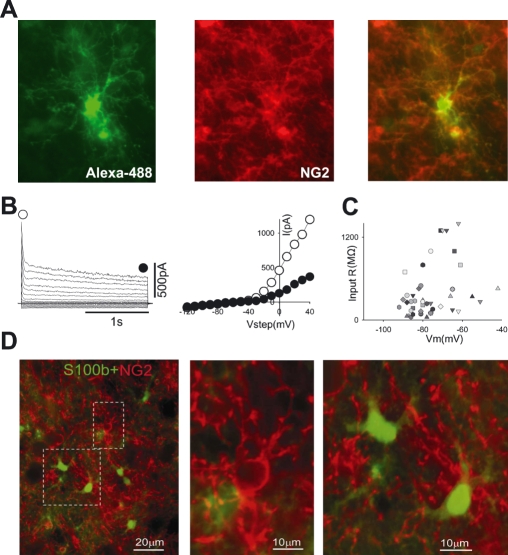
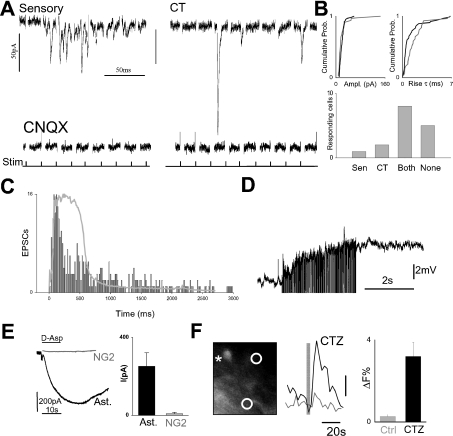
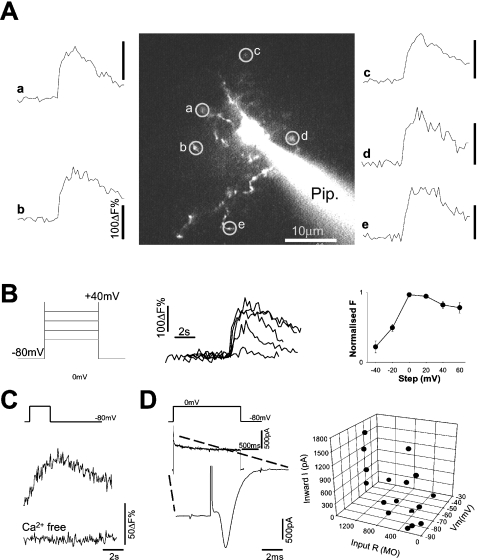
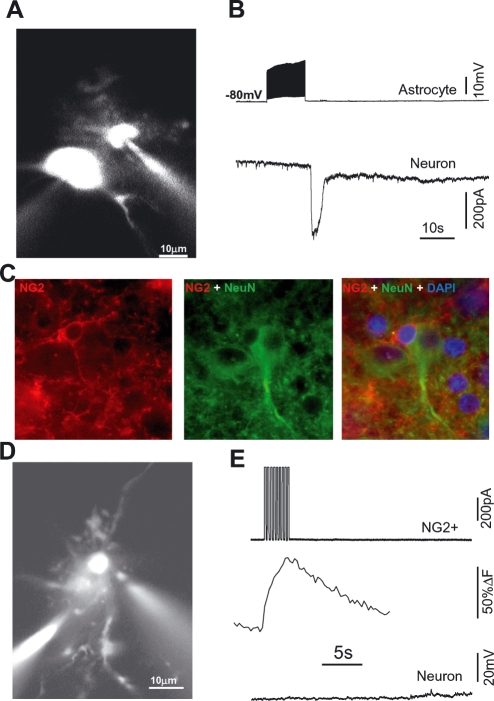
The rodent ventrobasal (VB) thalamus receives sensory inputs from the whiskers and projects to the cortex, from which it receives reciprocal excitatory afferents. Much is known about the properties and functional roles of these glutamatergic inputs to thalamocortical neurons in the VB, but no data are available on how these afferents can affect thalamic glial cells. In this study, we used combined electrophysiological recordings and intracellular calcium ([Ca(2+)](i)) imaging to investigate glial cell responses to synaptic afferent stimulation. VB thalamus glial cells can be divided into two groups based on their [Ca(2+)](i) and electrophysiological responses to sensory and corticothalamic stimulation. One group consists of astrocytes, which stain positively for S100B and preferentially load with SR101, have linear current-voltage relations and low input resistance, show no voltage-dependent [Ca(2+)](i) responses, but express mGluR5-dependent [Ca(2+)](i) transients following stimulation of the sensory and/or corticothalamic excitatory afferent pathways. Cells of the other glial group, by contrast, stain positively for NG2, and are characterized by high input resistance, the presence of voltage-dependent [Ca(2+)](i) elevations and voltage-gated inward currents. There were no synaptically induced [Ca(2+)](i) elevations in these cells under control conditions. These results show that thalamic glial cell responses to synaptic input exhibit different properties to those of thalamocortical neurons. As VB astrocytes can respond to synaptic stimulation and signal to neighbouring neurons, this glial cell organization may have functional implications for the processing of somatosensory information and modulation of behavioural state-dependent thalamocortical network activities.


Figures

Fig. 1
Fig. 1
VB astrocytes respond to synaptic stimulation with [Ca2+]i elevations. (A) Pseudocolour images (left) taken before (a) and just after (b) sensory stimulation in a Fluo-4AM-loaded slice. Right: upper trace displays characteristic neuronal transient [Ca2+]i elevations, bottom traces (marked 1 and 2) display the fluorescence shown by the correspondingly circled cells in the images (b) on the left. The sensory stimulation (1 s, 50 Hz) is indicated by yellow bars. Both neuronal and astrocytic responses are abolished in the presence of tetrodotoxin (1 μm) (gap in the traces is 5 min). A movie of this experiment is shown as Supplementary Movie S1. (B) One of the astrocytes indicated in A was patched with an Alexa 488 hydrazide-filled electrode (left), and shows positive immunostaining for S100B (right). Centre image displays S100B staining in isolation. (C) Current records obtained from the astrocyte depicted in B shows passive non-rectifying characteristics (left). Currents measured at the points indicated by the open and filled circles are plotted in the current–voltage relationship (right). (D) Scatterplot of input resistance versus resting membrane potential (Vm) for 35 astrocytes.
Fig. 4
Fig. 4
Astrocytic [Ca2+]i responses to synaptic stimulation are mediated by mGluR5. (A) Traces of fluorescence versus time from the two red-circled astrocytes in the top images (b) are shown, with lower-case letters corresponding to times of images (top). Time of CT stimulation is indicated by the red bars. (B and C) Histograms displaying pooled data from similar experiments as in A for sensory (n=6) and CT (n=7) stimulation, respectively. Histograms on the left show the number of astrocytes responding to the input in control, MPEP and wash, and histograms on the right display the fluorescence values under the same experimental conditions (*P<0.05, **P<0.005). (D) Images taken in control (a) and during CT stimulation (b), with white-dashed circles denoting neuronal [Ca2+]i elevations. In (c), red circles mark astrocytes showing [Ca2+]i elevations in response to CT stimulation, and (d) is an image taken following CHPG application. Fluorescent traces from a neuron (N) and an astrocyte (A) are displayed to the right with letters corresponding to times of displayed images. (E) The image on the left shows S100B-stained astrocytes, the centre image shows the same slice stained for mGluR5, and the image on the right shows co-localization of mGluR5 and S100B staining, which is particularly evident on astrocytic processes (white arrows). (F) Images taken during an experiment where sensory input was stimulated. Traces on the right show the fluorescence changes in response to sensory stimulation (yellow bar) and 100 μm DHPG in the red-circled astrocytes. Monochrome fluorescent image (centre) taken at the end of the experiment, after a neuron (N) had been filled with Alexa 488 hydrazide via the patch electrode. The image on the right displays the same area of the slice, where the Alexa-filled neuron was used to provide a reference point for slice orientation after the staining for S100B. Yellow circles in monochrome image denote synaptically responsive cells, and arrows indicate their correspondence to identified S100B-stained astrocytes. The dashed box denotes area in pseudocolour images on far left.
Fig. 2
Fig. 2
Afferent input induces astrocytic Ca2+elevations. (A) Monochrome image displaying the positions of astrocytes that only responded to sensory (yellow circles) or CT (red circles) stimulation, and to both synaptic inputs (white circles). Example fluorescence traces for one astrocyte from each group are displayed to the right (CT stimulation: red bar; sensory stimulation: yellow bar). (B) Histogram displaying the pooled data from similar experiments (n=7) as in A. (C) A single patch-clamped astrocyte is filled with Fluo 4, and [Ca2+]i elevations are monitored in response to CT and sensory stimulation. Fluorescence traces for three parts of the astrocyte: process 1 (P1), soma (S) and process 2 (P2) are illustrated to the right, while the currents elicited by CT (red bar) and sensory (yellow bar) stimulation are displayed below. A movie of this experiment is shown as Supplementary Movie S2. (D) Histogram displaying the number of astrocytes responding to sensory (Sen) and/or CT stimulation, or to neither afferents (grey bar), of a total of 60 patch-clamped astrocytes.
Fig. 3
Fig. 3
Synaptic input-sensitivity of thalamic astrocytes. (A) Currents elicited in an astrocyte following a 1-s, 400-μA stimulus to sensory (grey trace) and CT (black trace) afferents. Amplitudes of elicited currents to varying stimuli for this cell are illustrated in the plot to the right (sensory responses yellow, CT responses red). Plot on the far right displays pooled data for four cells. (B) [Ca2+]i elevations in response to sensory (grey trace) and CT (black trace) activation in the same astrocyte. Amplitudes of fluorescent responses to different stimulus magnitudes are plotted to the right. Plot on the far right displays pooled data for four cells. (C) Pseudocolour ratio image of a VB slice loaded with Fura-2AM. Red circles indicate positions of cells responding to afferent activation. Percentage changes of the ratio are plotted for the corresponding numbered cells to the right (grey traces depict ratios during sensory stimulation, black traces during CT stimulation). Dotted vertical grey lines indicate the timings of afferent activation at 200 and 400 μA respectively. (D) Summary data from four such experiments showing ratio changes in astrocytic populations to sensory (yellow bars) and CT (red bars) stimulation. ***P<0.0005. (E) Traces on the left show [Ca2+]i elevations in three cells following increasing number of stimuli in sensory (grey traces) and CT (black traces) pathways. Dotted vertical lines indicate timings of stimulation. Histograms to the right show summary data for different numbers of stimuli to sensory (yellow bars) and CT (red bars) afferents.
Fig. 5
Fig. 5
Properties of synaptically elicited inward currents in thalamic astrocytes. (A) Astrocytic current response to CT or sensory (Sen) synaptic stimulation (left), and to simultaneous stimulation of both afferents (right, black trace). The superimposed grey trace is the arithmetic sum of the two responses shown on the left. (B) Effect of 20 μm CNQX on a synaptically induced astrocytic current. (C) Histogram (on the right) summarizing the effect of CNQX on sensory- (yellow bars) and CT-elicited (red bars) currents. (D) Synaptically induced inward current in an astrocyte under control conditions (black trace) and in the presence of 300 μm DHK (grey trace). Red bar indicates duration of CT stimulus. (E) Images taken before synaptic stimulation (a), following simultaneous CT and sensory stimulation (b), during 300 μm DHK perfusion (c), and following simultaneous synaptic stimulation of both inputs in the presence of DHK (d). Red circles indicate astrocytes responding to stimulation before DHK application, and white circled astrocytes are those that only responded to synaptic stimulation in the presence of DHK. (F) Traces show fluorescence changes over time for astrocytes 1, 2 and 3 (as marked in Eb and Ed), with time of images indicated by corresponding letters. Histogram showing number of astrocytes responding to synaptic stimulation of sensory and CT inputs in control and in the presence of 300 μM DHK (n=9 slices) (*P<0.05).
Fig. 6
Fig. 6
Electrophysiological and morphological properties of VB NG2+ cells. (A) Images of a cell filled via a patch pipette with Alexa 488 hydrazide (left), and subsequently stained for NG2 (centre). Co-localization of the two markers (right) indicates the NG2+ identity of the recorded glial cell. (B) Currents elicited during voltage steps from −80 mV in the NG2+ cell illustrated in A. Current–voltage plot (right) measured at the times indicated by the white and black circles in the current traces. (C) Plot of the input resistance (Input R) versus resting membrane potential (Vm) for NG2+ cells, where each symbol represents a different cell. (D) Rightmost image shows slice stained for S100B (green) and NG2 (red) (left). The lack of co-localization indicates distinct identities of astrocytes and NG2+ cells in the VB. An NG2 cell is contained in the upper delimited area and is shown enlarged in the centre image. An enlargement of the lower delimited area illustrating astrocytic staining is shown in the leftmost image.
Fig. 7
Fig. 7
Properties of synaptically elicited inward currents in VB NG2+ cells. (A) Transient currents elicited by sensory and CT stimulation in the same NG2+ cell (top traces) are abolished by 20 μm CNQX (bottom traces). (B) Cumulative probability distribution plots for amplitude and rise τ of sensory- (black) and CT- (grey) elicited currents in NG2+ cells. Histogram below displays the number of NG2+ cells expressing transient inward currents exclusively to sensory and/or CT stimulation, and NG2+ cells that did not respond to any synaptic stimulation. (C) Histogram of excitatory postsynaptic current emergence in NG2+ cells during 50-Hz synaptic stimulation trains. The superimposed grey trace is an inverted evoked neuronal current from one of the slices for comparison. (D) An NG2+ cell is depolarized by simultaneous sensory and CT simulation. (E) Currents evoked in an NG2+ cell (grey trace) and in an astrocyte by application of d-aspartate. Histogram on the right summarizes data from eight experiments. (F) Image of an SR101-loaded slice, with white circles showing the position of cells responding to CT synaptic stimulation following cyclothiazide application that are distinct from the location of an SR101-positive astrocyte (asterisked). Traces on the right depict stimulation-evoked [Ca2+]i elevations in control conditions and in the presence of cyclothazide (CTZ) (100 μm). Histogram on the far right displays summary data.
Fig. 8
Fig. 8
[Ca2+]i elevations in, and intrinsic current properties of, NG2+ cells. (A) Monochrome fluorescent image (centre) of an NG2+ cell filled with Fluo-4 via the patch pipette (labelled as Pip). The surrounding traces (a–e) display fluorescence over time for the different circled processes when the cell is depolarized from −80 to 0 mV. (B) Voltage-step protocol applied to the cell illustrated in A and the resulting fluorescence changes (middle) measured in processes (b). Plot on the far right shows the normalized fluorescence versus voltage relationship for the five processes illustrated in A. (C) Fluorescence traces showing response to a depolarization step (top) in control (middle) and Ca2+-free perfusion medium (bottom). (D) Current elicited during a depolarizing step with expanded section showing fast inward, putative INa. Three-dimensional scattergram on the right displays the relationship between the transient inward current, input resistance and membrane potential (Vm) for 17 NG2+ cells.
Fig. 9
Fig. 9
Thalamic astrocytes, but not NG2+ cells, signal to TC neurons. (A) Image showing a patch-clamped neuron and a patch-clamped astrocyte filled with Fluo-4. (B) Top trace is the voltage recorded from the astrocyte in A, and the bottom trace shows the current elicited in the neuron depicted in A when the astrocyte is depolarized by a train of 50-Hz stimuli. (C) NG2+ cell in the VB (left). Middle image reveals a neuron when the same slice is stained with a neuronal marker (NeuN). Addition of DAPI staining (right) highlights the close association of NG2+ cells and neurons in the VB. (D) Image from an experiment where an NG2+ cell and a closely apposed neuron are patch-clamped. (E) Delivering voltage-steps of +30 mV to the NG2+ cell shown in D (top trace) elicited a [Ca2+]i elevation (middle trace), but no effect is observed in the membrane potential (bottom trace) of the simultaneously recorded neuron shown in D.

Comment in

Similar articles

Cited by

References

    1. Aguado F, Espinosa-Parrilla JF, Carmona MA, Soriano E. Neuronal activity regulates correlated network properties of spontaneous calcium transients in astrocytes in situ. J. Neurosci. 2002;22:9430–9444. - PMC - PubMed
    1. Aguirre AA, Chittajallu R, Belachew S, Gallo V. NG2-expressing cells in the subventricular zone are type C-like cells and contribute to interneuron generation in the postnatal hippocampus. J. Cell Biol. 2004;165:575–589. - PMC - PubMed
    1. Barbaresi P, Spreafico R, Frassoni C, Rustioni A. GABAergic neurons are present in the dorsal column nuclei but not in the ventroposterior complex of rats. Brain Res. 1986;382:305–326. - PubMed
    1. Belachew S, Chittajallu R, Aguirre AA, Yuan X, Kirby M, Anderson S, Gallo V. Postnatal NG2 proteoglycan-expressing progenitor cells are intrinsically multipotent and generate functional neurons. J. Cell Biol. 2003;161:169–186. - PMC - PubMed
    1. Bergles DE, Roberts JD, Somogyi P, Jahr CE. Glutamatergic synapses on oligodendrocyte precursor cells in the hippocampus. Nature. 2000;405:187–191. - PubMed

Publication types

Substances