

Increased activity and expression of histone deacetylase 1 in relation to tumor necrosis factor-alpha in synovial tissue of rheumatoid arthritis
- PMID: 20609223
- PMCID: PMC2945023
- DOI: 10.1186/ar3071
Increased activity and expression of histone deacetylase 1 in relation to tumor necrosis factor-alpha in synovial tissue of rheumatoid arthritis
Abstract
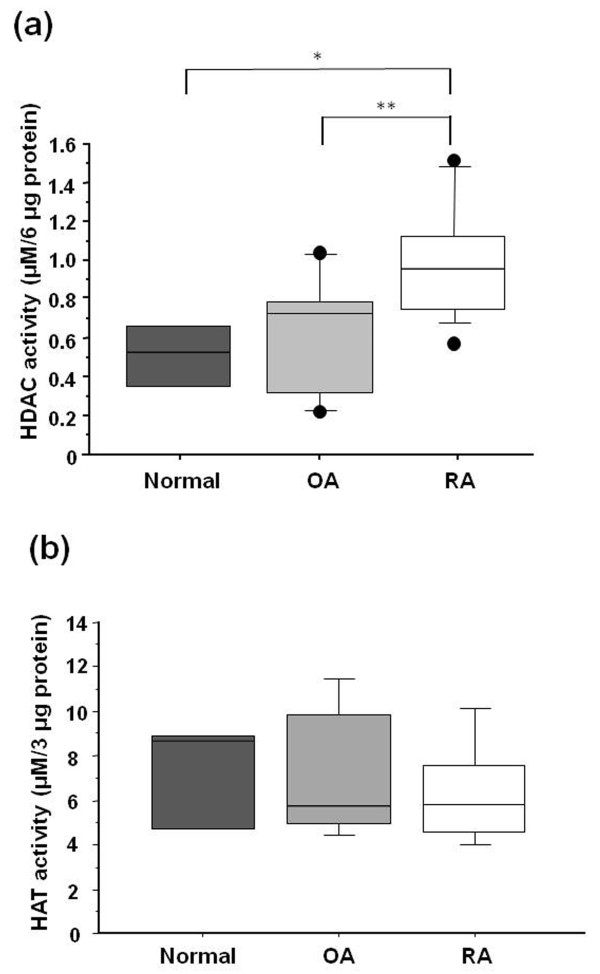
Introduction: The purpose of this study was to investigate the profile of histone deacetylase (HDAC) expression in the synovial tissue of rheumatoid arthritis (RA) compared with that of normal control and osteoarthritis (OA), and to examine whether there is a link between HDAC activity and synovial inflammation.
Methods: HDAC activity and histone acetyltransferase (HAT) activity were determined in nuclear extracts of total synovial tissue surgically obtained from normal, OA and RA joints. The level of cytoplasmic tumor necrosis factor a (TNFα) fraction was measured by ELISA. Total RNA of synovial tissue was used for RT-PCR of HDAC1-8. In synovial fibroblasts from RA (RASFs), the effects of TNFα on nuclear HDAC activity and class I HDACs (1, 2, 3, 8) mRNA expressions were examined by quantitative real-time PCR. The protein expression and distribution of class I HDACs were examined by Western blotting.
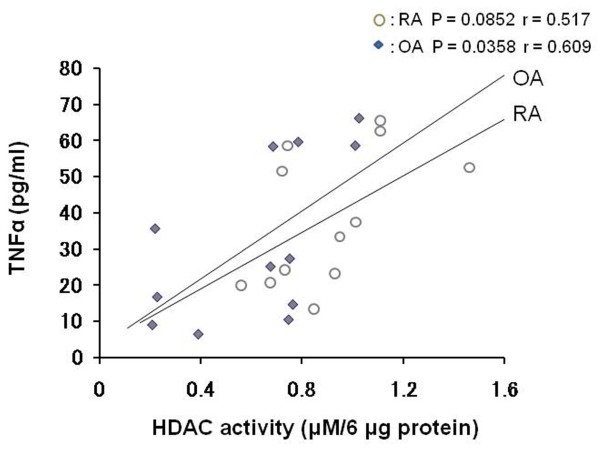
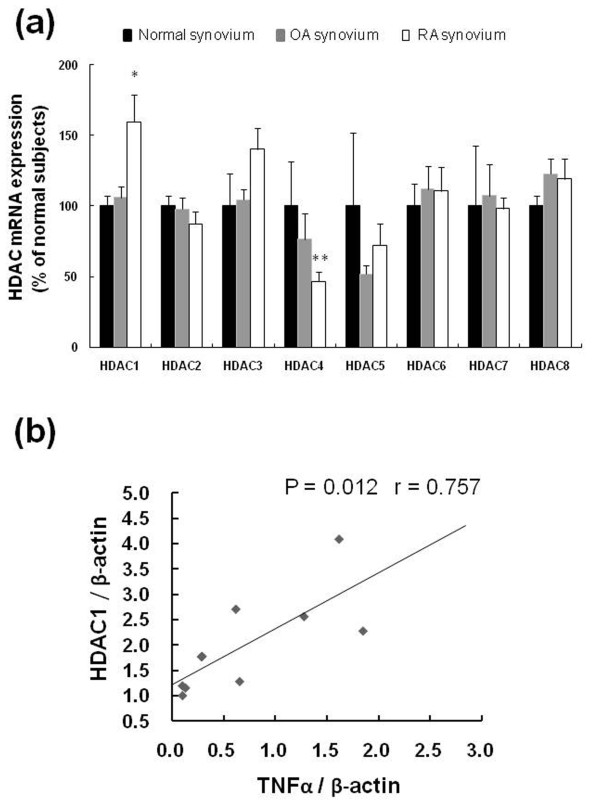
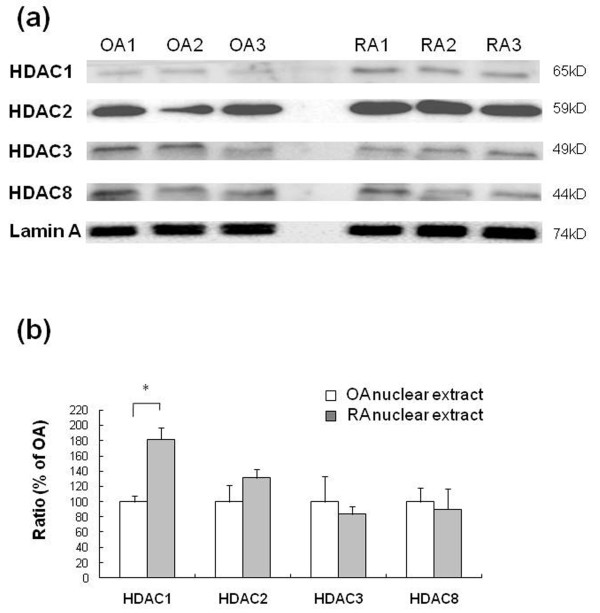
Results: Nuclear HDAC activity was significantly higher in RA than in OA and normal controls and correlated with the amount of cytoplasmic TNFα. The mRNA expression of HDAC1 in RA synovial tissue was higher than in OA and normal controls, and showed positive correlation with TNFα mRNA expression. The protein level of nuclear HDAC1 was higher in RA synovial tissue compared with OA synovial tissue. Stimulation with TNFα significantly increased the nuclear HDAC activity and HDAC1 mRNA expression at 24 hours and HDAC1 protein expression at 48 hours in RASFs.
Conclusions: Our results showed nuclear HDAC activity and expression of HDAC1 were significantly higher in RA than in OA synovial tissues, and they were upregulated by TNFα stimulation in RASFs. These data might provide important clues for the development of specific small molecule HDAC inhibitors.
Figures
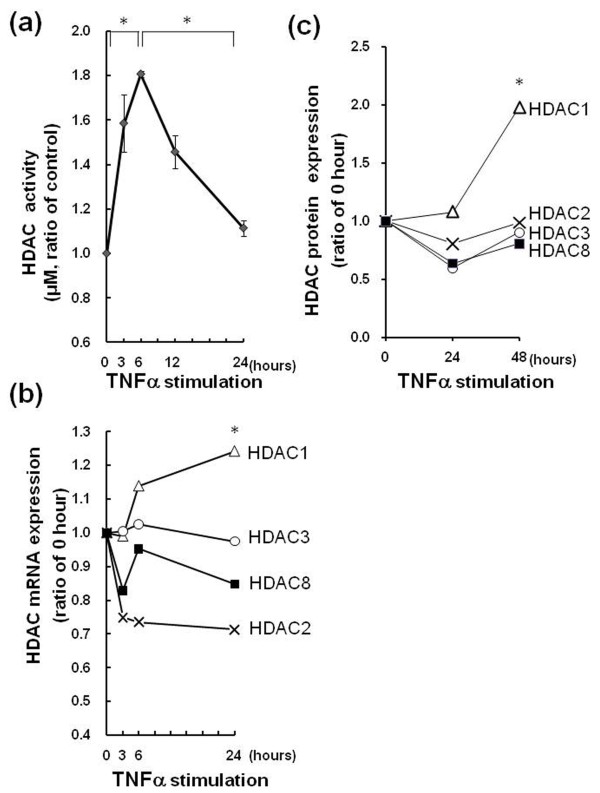
 actin expression and compared with 0 h. * = P < 0.05 versus HDAC2, 3, 8. (c) Quantitative results of Western blot analysis of nuclear class I HDACs protein expression in RASFs. The band intensity of class I HDACs was measured by Image J software. For analysis, levels of protein expression were normalized by lamin A and compared with 0 h. * = P < 0.05 versus HDAC3 and HDAC8 at 48 h.
Comment in
-
Histone deacetylases in RA: epigenetics and epiphenomena.Arthritis Res Ther. 2010;12(5):142. doi: 10.1186/ar3137. Epub 2010 Oct 11. Arthritis Res Ther. 2010. PMID: 20959025 Free PMC article.
References
MeSH terms
Substances
LinkOut - more resources
Full Text Sources
Medical
Miscellaneous
