

Robustness analysis of culturing perturbations on Escherichia coli colony biofilm beta-lactam and aminoglycoside antibiotic tolerance
- PMID: 20609240
- PMCID: PMC2912858
- DOI: 10.1186/1471-2180-10-185
Robustness analysis of culturing perturbations on Escherichia coli colony biofilm beta-lactam and aminoglycoside antibiotic tolerance
Abstract
Background: Biofilms are ubiquitous. For instance, the majority of medical infections are thought to involve biofilms. However even after decades of investigation, the in vivo efficacy of many antimicrobial strategies is still debated suggesting there is a need for better understanding of biofilm antimicrobial tolerances. The current study's goal is to characterize the robustness of biofilm antibiotic tolerance to medically and industrially relevant culturing perturbations. By definition, robust systems will return similar, predictable responses when perturbed while non-robust systems will return very different and potentially unpredictable responses. The predictability of an antibiotic tolerance response is essential to developing, testing, and employing antimicrobial strategies.
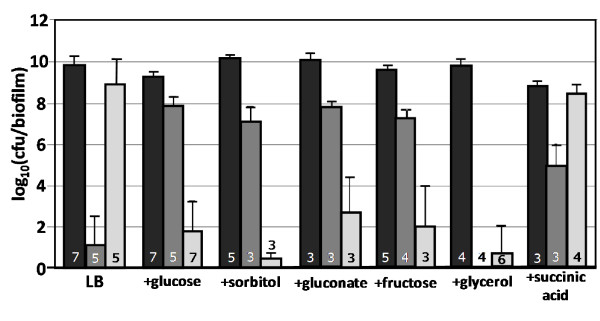
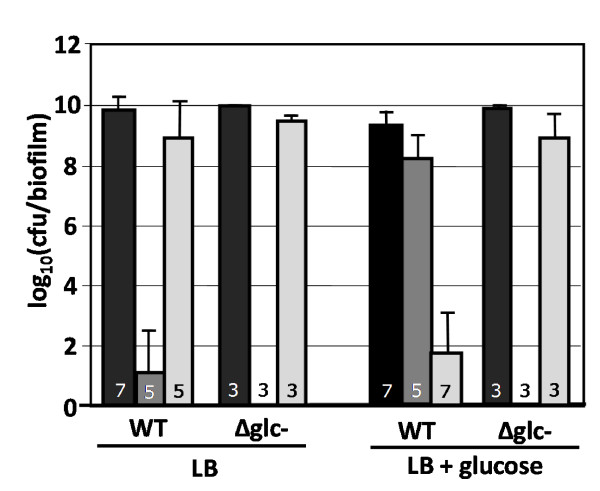
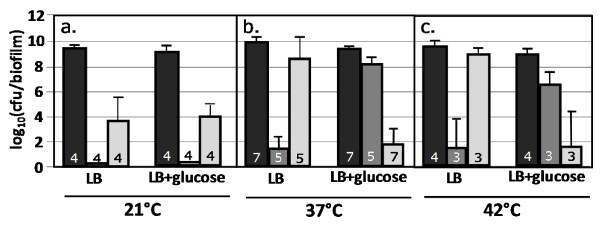
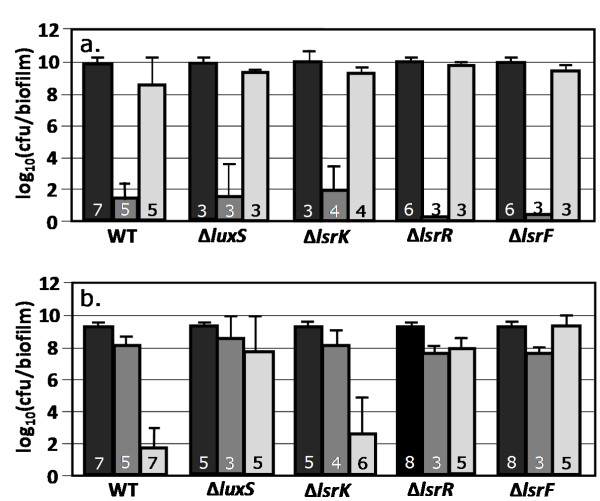
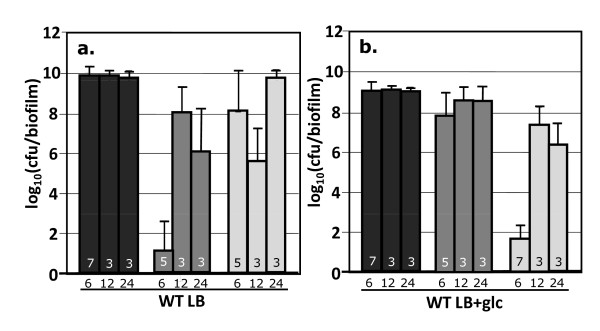
Results: The antibiotic tolerance of Escherichia coli colony biofilms was tested against beta-lactam and aminoglycoside class antibiotics. Control scenario tolerances were compared to tolerances under culturing perturbations including 1) different nutritional environments 2) different temperatures 3) interruption of cellular quorum sensing and 4) different biofilm culture ages. Here, antibiotic tolerance was defined in terms of culturable biofilm cells recovered after a twenty four hour antibiotic treatment.Colony biofilm antibiotic tolerances were not robust to perturbations. Altering basic culturing parameters like nutritional environment or temperature resulted in very different, non-intuitive antibiotic tolerance responses. Some minor perturbations like increasing the glucose concentration from 0.1 to 1 g/L caused a ten million fold difference in culturable cells over a twenty four hour antibiotic treatment.
Conclusions: The current study presents a basis for robustness analysis of biofilm antibiotic tolerance. Biofilm antibiotic tolerance can vary in unpredictable manners based on modest changes in culturing conditions. Common antimicrobial testing methods, which only consider a single culturing condition, are not desirable since slight culturing variations can lead to very different outcomes. The presented data suggest it is essential to test antimicrobial strategies over a range of culturing perturbations relevant to the targeted application. In addition, the highly dynamic antibiotic tolerance responses observed here may explain why some current antimicrobial strategies occasionally fail.
Figures


Similar articles
-
Aminoglycosides Antagonize Bacteriophage Proliferation, Attenuating Phage Suppression of Bacterial Growth, Biofilm Formation, and Antibiotic Resistance.Appl Environ Microbiol. 2021 Jul 13;87(15):e0046821. doi: 10.1128/AEM.00468-21. Epub 2021 Jul 13. Appl Environ Microbiol. 2021. PMID: 34020940 Free PMC article.
-
Increased antibiotic resistance of Escherichia coli in mature biofilms.Appl Environ Microbiol. 2009 Jun;75(12):4093-100. doi: 10.1128/AEM.02949-08. Epub 2009 Apr 17. Appl Environ Microbiol. 2009. PMID: 19376922 Free PMC article.
-
Antibiotic Susceptibility of Escherichia coli Cells during Early-Stage Biofilm Formation.J Bacteriol. 2019 Aug 22;201(18):e00034-19. doi: 10.1128/JB.00034-19. Print 2019 Sep 15. J Bacteriol. 2019. PMID: 31061169 Free PMC article.
-
Escherichia coli biofilm: development and therapeutic strategies.J Appl Microbiol. 2016 Aug;121(2):309-19. doi: 10.1111/jam.13078. Epub 2016 Mar 11. J Appl Microbiol. 2016. PMID: 26811181 Review.
-
Alternative strategies for the application of aminoglycoside antibiotics against the biofilm-forming human pathogenic bacteria.Appl Microbiol Biotechnol. 2020 Mar;104(5):1955-1976. doi: 10.1007/s00253-020-10360-1. Epub 2020 Jan 22. Appl Microbiol Biotechnol. 2020. PMID: 31970432 Review.
Cited by
-
Immobilized Hydrolytic Enzymes Exhibit Antibiofilm Activity Against Escherichia coli at Sub-Lethal Concentrations.Curr Microbiol. 2015 Jul;71(1):106-14. doi: 10.1007/s00284-015-0834-6. Epub 2015 May 10. Curr Microbiol. 2015. PMID: 25958074
-
The bactericidal activity of β-lactam antibiotics is increased by metabolizable sugar species.Microbiology (Reading). 2015 Oct;161(10):1999-2007. doi: 10.1099/mic.0.000152. Epub 2015 Aug 4. Microbiology (Reading). 2015. PMID: 26243263 Free PMC article.
-
The importance of understanding the infectious microenvironment.Lancet Infect Dis. 2022 Mar;22(3):e88-e92. doi: 10.1016/S1473-3099(21)00122-5. Epub 2021 Sep 7. Lancet Infect Dis. 2022. PMID: 34506737 Free PMC article. Review.
-
Saccharomyces cerevisiae biofilm tolerance towards systemic antifungals depends on growth phase.BMC Microbiol. 2014 Dec 4;14:305. doi: 10.1186/s12866-014-0305-4. BMC Microbiol. 2014. PMID: 25472667 Free PMC article.
-
Sub-Optimal Treatment of Bacterial Biofilms.Antibiotics (Basel). 2016 Jun 22;5(2):23. doi: 10.3390/antibiotics5020023. Antibiotics (Basel). 2016. PMID: 27338489 Free PMC article. Review.
References
-
- Hoyle BD, Costerton JW. Bacterial resistance to antibiotics: the role of biofilms. Prog Drug Res. 1991;37:91–105. - PubMed
Publication types
MeSH terms
Substances
Grants and funding
LinkOut - more resources
Full Text Sources
Other Literature Sources
Medical
Molecular Biology Databases
Research Materials
