Beyond co-localization: inferring spatial interactions between sub-cellular structures from microscopy images
- PMID: 20609242
- PMCID: PMC2919515
- DOI: 10.1186/1471-2105-11-372
Beyond co-localization: inferring spatial interactions between sub-cellular structures from microscopy images
Abstract
Background: Sub-cellular structures interact in numerous direct and indirect ways in order to fulfill cellular functions. While direct molecular interactions crucially depend on spatial proximity, other interactions typically result in spatial correlations between the interacting structures. Such correlations are the target of microscopy-based co-localization analysis, which can provide hints of potential interactions. Two complementary approaches to co-localization analysis can be distinguished: intensity correlation methods capitalize on pattern discovery, whereas object-based methods emphasize detection power.
Results: We first reinvestigate the classical co-localization measure in the context of spatial point pattern analysis. This allows us to unravel the set of implicit assumptions inherent to this measure and to identify potential confounding factors commonly ignored. We generalize object-based co-localization analysis to a statistical framework involving spatial point processes. In this framework, interactions are understood as position co-dependencies in the observed localization patterns. The framework is based on a model of effective pairwise interaction potentials and the specification of a null hypothesis for the expected pattern in the absence of interaction. Inferred interaction potentials thus reflect all significant effects that are not explained by the null hypothesis. Our model enables the use of a wealth of well-known statistical methods for analyzing experimental data, as demonstrated on synthetic data and in a case study considering virus entry into live cells. We show that the classical co-localization measure typically under-exploits the information contained in our data.
Conclusions: We establish a connection between co-localization and spatial interaction of sub-cellular structures by formulating the object-based interaction analysis problem in a spatial statistics framework based on nearest-neighbor distance distributions. We provide generic procedures for inferring interaction strengths and quantifying their relative statistical significance from sets of discrete objects as provided by image analysis methods. Within our framework, an interaction potential can either refer to a phenomenological or a mechanistic model of a physico-chemical interaction process. This increased flexibility in designing and testing different hypothetical interaction models can be used to quantify the parameters of a specific interaction model or may catalyze the discovery of functional relations.
Figures

 (dots) and circular objects
  (solid circles). For all distances d, the state density q(d) is proportional to the total length of the d-isoline (dashed lines) in Ω. The expected co-localization in the absence of interactions,
  , is proportional to the area enclosed by the t-isoline (gray region). (B)-(D) Effect of the positioning of the objects Y on q(d), illustrating the influence of the cellular context.
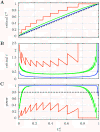
 (B) that allows rejecting H0: "no interaction" (α = 0.05) as a function of the base-level
  . In A, the expected value of Ct under H0 is indicated by a dashed line. (C) Statistical power (1 - β) for detecting interactions of a true strength ϵ = 1. Red, green, and blue lines correspond to N = 10, 100, and 1000, respectively, in all three panels.


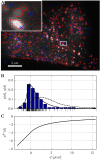
 = 3.90,
  = 3.96) of the interactions between viruses and nearest endosomes.
Similar articles
-
Spatial Pattern Analysis using Closest Events (SPACE)-A Nearest Neighbor Point Pattern Analysis Framework for Assessing Spatial Relationships from Digital Images.Microsc Microanal. 2024 Apr 29;30(2):306-317. doi: 10.1093/mam/ozae022. Microsc Microanal. 2024. PMID: 38498601 Free PMC article.
-
MosaicIA: an ImageJ/Fiji plugin for spatial pattern and interaction analysis.BMC Bioinformatics. 2013 Dec 3;14:349. doi: 10.1186/1471-2105-14-349. BMC Bioinformatics. 2013. PMID: 24299066 Free PMC article.
-
Visualizing and clustering high throughput sub-cellular localization imaging.BMC Bioinformatics. 2008 Feb 4;9:81. doi: 10.1186/1471-2105-9-81. BMC Bioinformatics. 2008. PMID: 18241353 Free PMC article.
-
Statistical analysis of molecule colocalization in bioimaging.Cytometry A. 2015 Jun;87(6):568-79. doi: 10.1002/cyto.a.22629. Epub 2015 Jan 20. Cytometry A. 2015. PMID: 25605428 Review.
-
Spatial quantitative analysis of fluorescently labeled nuclear structures: problems, methods, pitfalls.Chromosome Res. 2008;16(3):523-62. doi: 10.1007/s10577-008-1236-4. Chromosome Res. 2008. PMID: 18461488 Review.
Cited by
-
Probabilistic spatial analysis in quantitative microscopy with uncertainty-aware cell detection using deep Bayesian regression.Sci Adv. 2022 Feb 4;8(5):eabi8295. doi: 10.1126/sciadv.abi8295. Epub 2022 Feb 4. Sci Adv. 2022. PMID: 35119934 Free PMC article.
-
Identification of nanoparticles as vesicular cargo via Airy scanning fluorescence microscopy and spatial statistics.Nanoscale Adv. 2023 Jun 14;5(13):3512-3520. doi: 10.1039/d3na00188a. eCollection 2023 Jun 27. Nanoscale Adv. 2023. PMID: 37383069 Free PMC article.
-
Closing the multichannel gap through computational reconstruction of interaction in super-resolution microscopy.Patterns (N Y). 2025 Mar 27;6(5):101181. doi: 10.1016/j.patter.2025.101181. eCollection 2025 May 9. Patterns (N Y). 2025. PMID: 40486966 Free PMC article. Review.
-
CIRCOAST: a statistical hypothesis test for cellular colocalization with network structures.Bioinformatics. 2019 Feb 1;35(3):506-514. doi: 10.1093/bioinformatics/bty638. Bioinformatics. 2019. PMID: 30032263 Free PMC article.
-
Neuronal ER-plasma membrane junctions organized by Kv2-VAP pairing recruit Nir proteins and affect phosphoinositide homeostasis.J Biol Chem. 2019 Nov 22;294(47):17735-17757. doi: 10.1074/jbc.RA119.007635. Epub 2019 Oct 8. J Biol Chem. 2019. PMID: 31594866 Free PMC article.
References
Publication types
MeSH terms
LinkOut - more resources
Full Text Sources
Other Literature Sources

