. 2010 Jul 13;18(1):23-38.
doi: 10.1016/j.ccr.2010.05.024.

Siah2-dependent concerted activity of HIF and FoxA2 regulates formation of neuroendocrine phenotype and neuroendocrine prostate tumors

Affiliations

Siah2-dependent concerted activity of HIF and FoxA2 regulates formation of neuroendocrine phenotype and neuroendocrine prostate tumors

Jianfei Qi et al. Cancer Cell. .

Abstract

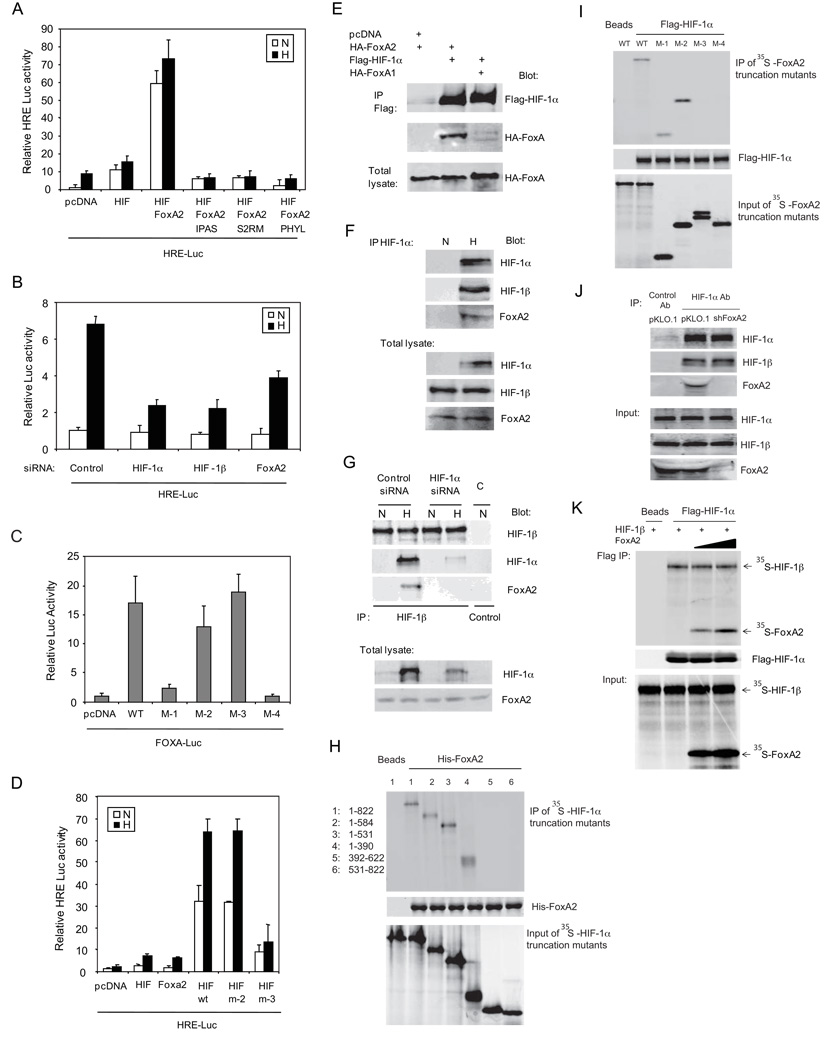
Neuroendocrine (NE) phenotype, seen in >30% of prostate adenocarcinomas (PCa), and NE prostate tumors are implicated in aggressive prostate cancer. Formation of NE prostate tumors in the TRAMP mouse model was suppressed in mice lacking the ubiquitin ligase Siah2, which regulates HIF-1alpha availability. Cooperation between HIF-1alpha and FoxA2, a transcription factor expressed in NE tissue, promotes recruitment of p300 to transactivate select HIF-regulated genes, Hes6, Sox9, and Jmjd1a. These HIF-regulated genes are highly expressed in metastatic PCa and required for hypoxia-mediated NE phenotype, metastasis in PCa, and the formation of NE tumors. Tissue-specific expression of FoxA2 combined with Siah2-dependent HIF-1alpha availability enables a transcriptional program required for NE prostate tumor development and NE phenotype in PCa.


Figures

Figure 1
Figure 1. Tumorigenesis in TRAMPTg/Siah2 mice
A. Primary tumor incidences of TRAMP mice with indicated Siah2 genotype are shown as percentages. B. Typical H&E staining of neuroendocrine carcinoma (NE) derived from TRAMP/Siah2+/− and AH derived from TRAMP/Siah2−/− mice. C. Incidence of NE and AH in TRAMP mice with indicated Siah genotypes. Number of mice for each genotype is indicated. Dark bars indicate NE+AH. p<0.005 for NE tumor incidence between control and Siah-deficient TRAMP mice. D. IHC analyses of primary NE carcinoma with indicated genotypes using the indicated antibodies. Arrows indicate normal prostate epithelial tissues. E. NSE and FoxA2 staining of the NE tumor foci of 5-month-old TRAMP mice. F. IHC staining of CD31 in NE carcinomas from mice of indicated genotypes. G. Re-expression of HIF-1α in PHYL-expressing TRAMP-C cells. Cells were stably transfected with indicated expression vectors. PHYL-expressing cells were further stably transfected with HIF-1α and maintained in normoxia (N) or hypoxia (H) for 6 h before analyses by western blot for HIF-1α. H. and I. TRAMP-C cells (3×10⁶) expressing control pKH3 vector, PHYL or PHYL+HIF-1α were injected subcutaneously into the flanks of nude mice. The frequency of tumor formation (H) and size of xenograft tumor (I) 8-weeks post injection are shown. In panel I, each column represents mean±SD (Standard Deviation) for 5 mice, p<0.05 for pKH3 vs. PHYL+HIF-1α. See also Figure S1 and Table S1.
Figure 2
Figure 2. Metastasis in TRAMPTg/Siah2 mice
A. H&E staining of indicated tissues from TRAMP mice of indicated Siah2 genotypes. Metastatic lesions are indicated by arrows. B. Expression of NE markers in metastatic lesions of TRAMP/Siah2+/− mice revealed by IHC staining with indicated antibodies. C. Percentage of metastases in TRAMP mice with indicated Siah genotypes. Number of mice and tissues examined: N=32 (S2+/+ and S2+/−), 16 (S2−/−), or 9 (S1a+/−:S2−/−) for liver and lung, and N=26 (S2+/+ and S2+/−), 11 (S2−/−), or 6 (S1a+/−:S2+/−) for lymph nodes. For each case, 5 serial sections of lung or liver were examined by H&E staining. D. TUNEL staining (dark brown signals indicated by arrows) of lung sections from TRAMP/Siah2+/− and TRAMP/Siah2−/− mice. E. IHC staining for PCNA on lung sections derived from TRAMP/Siah2+/− and TRAMP/Siah2−/− mice.
Figure 3
Figure 3. FoxA2 enhances HIF transcriptional activity
A. TRAMP-C cells were transfected with an HRE-Luc construct and the indicated plasmids. 24-h post transfection, cells were maintained in 1% oxygen for 10 h, and cell lysates were collected to measure luciferase activity. β-Gal plasmid was used to normalize for transfection efficiency. N and H denote normoxia and hypoxia, respectively. p<0.01 pcDNA (N) vs. HIF (N), p<0.0005 HIF (N) vs. HIF+FoxA2 (N). B. TRAMP-C cells were first transfected with indicated siRNAs then 48-h later with an HRE-luc construct. 24 h after the second transfection, cells were maintained in 1% oxygen for 10 h before analysis of luciferase activity. p<0.005 for Control (H) vs. HIF-1α (H), HIF-1β (H), or FoxA2 (H). C. TRAMP-C cells were transfected with the FOXA-Luc construct and indicated FoxA2 deletion mutants. 24-h post transfection, cells were treated with 1% oxygen for 10 h before analysis of luciferase activity. p<0.01 WT vs. M-1, p>0.1 WT vs. M-2 or M-3. D. TRAMP-C cells were transfected with an HRE-Luc construct and the indicated plasmids. 24-h post transfection, cells were maintained in 1% oxygen for 10 h before analysis of luciferase activity. p<0.001 HIF+WT (N) vs. HIF+m3 (N). Each column in panels A–D represents mean±SD of 3 replicates. E. 293T cells were transfected with indicated plasmids. HIF-1α was precipitated with Flag antibody-conjugated beads (M2) 48-h post transfection and the precipitated proteins were analyzed by immunoblot. F. TRAMP-C cells were maintained in 1% O2 for 5 h. Endogenous HIF-1α was precipitated and co-precipitated proteins were analyzed by immunoblot. G. TRAMP-C cells were transfected with HIF-1α siRNA for 48 h then maintained in hypoxia for 5 h. Endogenous HIF-1β was precipitated and co-precipitated proteins were analyzed by immunoblot. H. HIF-1α and its truncation mutants were translated in vitro, labeled with 35S, and incubated with Nickel beads coated with His-FoxA2. After 3 washes, proteins on the beads were separated by SDS-PAGE and transferred to nitrocellulose membrane. 35S-labeled HIF-1α was detected by phosphor-imager, followed by immunoblot with a His antibody to detect His-FoxA2. 4% of in vitro translated 35S-HIF-1α was used as input. I. Flag-HIF-1α was translated in vitro and bound to the M2 beads then incubated with 35S-labeled in vitro translated FoxA2 or its truncation mutants. Bound proteins were monitored as indicated in panel H. J. TRAMP-C cells were stably transfected with indicated vectors and then grown in 1% O2 for 6 h before immunoprecipitation of HIF-1α. The co-precipitated proteins were analyzed by western blot. K. Flag-HIF-1α was translated in vitro and bound to the M2 beads then incubated with 35S-labeled in vitro translated FoxA2 and HIF-1β. Bound proteins were monitored as indicated in panel H. See also Figure S2.
Figure 4
Figure 4. A subset of HIF target genes are regulated by cooperation with FoxA2
A. TRAMP-C cells were transfected with FoxA2 siRNAs. 48-h post transfection, cells were maintained in 1% oxygen for 10 h then RNA was isolated for qRT-PCR analyses of the indicated transcripts. Control (H) vs. FoxA2 (H): p>0.1 for VEGFA and Glut-1, p<0.005 for all others. B. TRAMP-C cells were transfected with indicated siRNAs. 48-h post transfection, cells were maintained in 1% oxygen for 10 h. RNA was isolated for qRT-PCR analyses of the Hes6 transcript. p<0.05 between control (H) and HIF-1α (H), or FoxA2 (H). C. TRAMP-C cells were transfected with a 1.25 kb Hes6 promoter-Luc construct containing the wild type or mutated −66 bp HRE. 24-h post transfection, cells were treated with DMOG (1 mM, 16 h) before analysis of luciferase activity. p<0.005 for WT Hes6 −DMOG vs. +DMOG, p>0.1 for mutant Hes6 −DMOG vs. +DMOG. D. TRAMP-C cells were transfected with indicated plasmids. 24-h post transfection, cells were treated with DMOG (1 mM, 16 h) before analysis of luciferase activity. WT Hes6: p<0.01 pcDNA−DMGO vs. pcDNA+DMOG, p<0.05 pcDNA+DMGO vs. Foxa2+DMOG. E. TRAMP-C cells were transfected with control or FoxA2 siRNA. 48-h post transfection, cells were grown in 1% oxygen for 5 h before ChIP assays of the HRE-containing region of Hes6 promoter were performed using indicated antibodies. PCR products were analyzed on 2% agarose gel electrophoresis. A representative reversed gel image of triplicate experiments is shown. F. FoxA2 shRNA-expressing cells were treated with 1% oxygen for 6 h and subjected to ChIP assays with p300 antibodies. The immunoprecipitated materials were used for QPCR analyses of the HRE-containing regions of VEGFA, Jmjd1a and Hes6. The results of ChIP QPCR were normalized to those of the input. p<0.01 for all genes between control and shFoxA2 for both cell lines. G Cells were transfected with control or p300 siRNA for 48 h then analyzed by qRT-PCR for the indicated transcripts. Both TRAMP-C and Rv1: p>0.1 control vs. p300 for VEGFA and p<0.05 for all others. H. TRAMP-C cells were co-transfected with Hes6 or VEGFA promoter-Luc vector, HIF-1α, and increasing amounts of p300. 24-h post transfection, cell lysates were collected for a luciferase assay. Hes6: p<0.001 0 µg vs. all three; VEGFA: p<0.005 0 µg vs. 0.5 µg, p>0.1 0 µg vs. the other two. I and J. TRAMP-C cells were transfected with Hes6 promoter-Luc (H) or VEGFA promoter-Luc (I) together with the plasmids indicated. 24-h post transfection, cell lysates were collected for analysis of luciferase activity. In panels A–D, F–J, each column represents mean±SD of 3 experiments. Hes6: p<0.01 HIF vs. HIF+FoxA2, HIF vs. HIF+p300, and HIF+FoxA2 vs. HIF+FoxA2+p300; VEGFA: p>0.1 for these comparisons. K. Flag-p300 was translated in vitro and coupled to M2 beads. HIF-1α or FoxA2 was translated in vitro and labeled with 35S. Equal amounts of 35S-HIF-1α and 35S-FoxA2 were incubated with M2 bead-bound Flag-p300. Bound proteins were monitored as indicated in Figure 3H. L. Flag-p300 (wt or ΔCH1) was translated in vitro and bound to M2 beads. HIF-1α and FoxA2 were translated in vitro and labeled with 35S. Equal amount of 35S-HIF-1α and 35S-FoxA2 was mixed and incubated with M2 bead-bound Flag-p300 or Flag-p300ΔCH1. Bound proteins were monitored as indicated in Figure 3H. See also Figure S3, Table S2, S3.
Figure 5
Figure 5. Hes6, Sox9 and Jmjd1a are required for tumorigenesis of TRAMP cells
A. TRAMP-C cells were stably transfected with indicated vectors. Inset shows western blot of PHYL and NxN. PHYL-expressing cells were then infected with retroviral constructs encoding Hes6, Sox9 or Jmjd1a individually or all together (HSJ). 1×10⁵ cells were monitored for growth on soft agar under 1% O2 for 3 weeks. Shown is the number of colonies per well of 6-well plate. p=0.4 (pBabe vs N×N), p=0.053 (N×N vs. PHYL+HSJ), p<0.0005 (N×N vs. PHYL, PHYL+Hes6, PHYL+Sox9, or PHYL+Jmjd1a), p<0.05 (PHYL+HSJ vs. PHYL, PHYL+Hes6, PHYL+Sox9, or PHYL+Jmjd1a). B. TRAMP-C cells were transfected with indicated shRNA. Inset shows western blot of FoxA2. shFoxA2-expressing cells were then infected with retroviral constructs of Hes6, Sox9 or Jmjd1a individually or all together (HSJ). 1×10⁵ cells were monitored for their growth on soft agar under 1% O2 for 3 weeks. Shown is the number of colonies per well of 6-well plate. In panel A and B, each column represents mean±SD for 3 replicates. p=0.06 (pKLO.1 vs. shFoxA2+HSJ), p<0.005 (pKLO.1 vs. shFoxA2, shFoxA2+Hes6, shFoxA2+Sox9, or shFoxA2+Jmjd1a), p<0.005 (shFoxA2+HSJ vs. shFoxA2, shFoxA2+Hes6, shFoxA2+Sox9, or shFoxA2+Jmjd1a). C, D, E, F. G. 1×10⁶ of TRAMP-C transfectants as described in Figure 5A and 5B were injected into the prostate of nude mice. Two months after injection, genitourinary tracts of mice were dissected and prostate tumor formation was quantified. Panel C shows the representative images of prostate tumors, which were indicated by arrows. Panels D and F depict the frequency of tumor formation. Panels E and G show the average size of the tumors formed. In panels E and F, each column represents mean±SD for 5 mice. p<0.05 pBabe vs. PHYL+HSJ and NxN vs. PHYL+HSJ, p<0.001 (pKLO.1 vs. shFoxA2, shFoxA2+Hes6, or shFoxA2+Jmjd1a), p<0.005 (shFoxA2+HSJ vs. shFoxA2, shFoxA2+Hes6, or shFoxA2+Jmjd1a), p<0.01 (pKLO.1 vs. shFoxA2+Sox9), p=0.2 (pKLO.1 vs. shFoxA2+HSJ). See also Figure S4.
Figure 6
Figure 6. Hypoxia-induced NE phenotype in human prostate cancer cells
A. CWR22Rv1 cells were cultured under normoxia or hypoxia (1% O2) for indicated times before qRT-PCR analysis of NSE and ChgB. Transcript levels under hypoxia were normalized to those under normoxia. p<0.05, p<0.005, p<0.0001 for NSE hypoxia vs. normoxia at days 1, 3 and 5, respectively. p=0.19, p<0.005, p<0.0001 for ChgB hypoxia vs. normoxia at days 1, 3 and 5, respectively. B. Rv1 cells were grown under 1% O2 for indicated times. The total lysates were used for western blot analyses of NSE and ChgB. Hes6 and Sox9 were immunoprecipitated followed by western blot analysis. C. Rv1 cells were seeded onto the tissue culture plate at low density and cultured in 1% O2 for 6 days. Cells were fixed and immunostaind for NSE or ChgB. Note the neurite-like protrusions from cells cultured under hypoxia. D. Rv1 cells were cultured under hypoxia for indicated times before qRT-PCR analysis. The transcript level under hypoxia was normalized to that of corresponding normoxia samples. P<0.005 for all three transcripts at all three time points. E. Rv1 cells were stably transfected with control pBabe vector or PHYL. Inset: western blot shows expression of PHYL. PHYL-expressing Rv1 cells were further infected with viral constructs of Hes6, Sox9 or Jmjd1a either individually or in combination (HSJ). Cells were cultured under 1% O2 for 5 days before qRT-PCR analysis of NSE. p<0.01 pBabe vs. PHYL+HSJ, P<0.0001 pBabe vs. all others, p<0.005 PHYL+HSJ vs. other PHYL-expressing cells. F. Rv1 cells were transfected with control pKLO.1 vector or FoxA2 shRNA. Inset: western blot shows the knockdown of FoxA2. shFoxA2-expressing cells were further infected with viral constructs of Hes6, Sox9 or Jmjd1a either individually or in combination (HSJ). Cells were cultured under 1% O2 for 5 days before qRT-PCR analysis of NSE. p<0.05 pKLO.1 vs. shFoxA2+HSJ, p<0.0001 pKLO.1 vs. all others, p<0.001 shFoxA2+HSJ vs. other shFoxA2-expressing cells. G. Rv1 transfectants were seeded on tissue culture plates at low density and maintained at 1% O2 for 6 days. The morphology of cells was examined under phase-contrast microscopy. The number of colonies with neurite-like structures (criteria: >1/3 of cells in the periphery of colonies have neurite-like structure that is over 20 µm long) were scored at triplicate of 6-well plates. p<0.01 pBabe vs. PHYL or PHYL+HSJ, p<0.001 PHYL+HSJ vs. PHYL, p<0.05 pKLO.1 vs. shFoxA2 or shFoxA2+HSJ, p<0.005 shFoxA2 vs. shFoxA2+HSJ. In panel A, D, E, F, G, each column represents mean±SD for 3 replicates. H. 1×10⁶ Rv1 transfectants as described in E and F were injected into the prostates of nude mice. 4-week-post injection, the orthotopic tumors were collected and size measured. p<0.05 pBabe vs. PHYL or PHYL+HSJ, p>0.1 PHYL vs. PHYL+HSJ and pKLO.1 vs. shFoxA2 or shFoxA2+HSJ. I. Blood was collected from the heart of mice described in H before the sacrifice, cultured in the selection medium for 2 weeks. The number of colonies on the plates was scored and normalized to the volume of blood. p<0.01 pBabe vs. PHYL or PHYL+HSJ, p<0.001 PHYL vs. PHYL+HSJ, p<0.05 pKLO.1 vs. shFoxA2 or shFoxA2+HSJ, p<0.005 shFoxA2 vs. shFoxA2+HSJ. In panel H and I, each column represents mean±SD for 5 mice. J. Lymph nodes (LN) were collected from the mice described in H, and stained with H & E to determine the metastases. p<0.05 (pBabe vs. PHYL), p=0.17 (PHYL vs. PHYL+HSJ), p<0.01 (pKLO.l vs. shFoxA2), p<0.05 (shFoxA2 vs. shFoxA2+HSJ). K. Orthotopic tumor sections as described in panel H were subjected to IHC staining of NSE, HIF-1α and FoxA2. L. The LN or liver metastasis from Rv1 Orthotopic model was subjected to IHC staining of NSE. See also Figure S5, Table S4.
Figure 7
Figure 7. Changes in HIF/FoxA2 targets in prostate tumors
A. Laser capture microdissection was performed to collect NE carcinoma cells from tumors of TRAMP/Siah2+/− or TRAMP/Siah2−/− mice. RNA was isolated for qRT-PCR analyses of indicated transcripts. Each column represents mean±SD for 2 replicates. Siah2+/− vs. Siah2−/− p<0.05 for Hes6, Sox9 and Jmjd1a, p=0.78 and 0.46 for VEGFA and Glut-1, respectively. B. IHC of FoxA2, Hes6, and HIF-1α was performed on a human prostate adenocarcinoma with NED foci. Shown are representative images with a corresponding NE control marker NSE. C. IHC staining using the indicated antibodies were performed on serial sections of 15 human PCa specimens, among which 10 cases have NE phenotype (NSE positive) and 5 cases have no NE phenotype (NSE negative). Co-expression of Hes6, Sox9 and Jmjd1a in human PCa with NE phenotype is statistically significant compared with that in human PCa without NE phenotype (p<0.05). D. IHC staining of the indicated proteins was performed on a human prostate TMA consisting PINs and prostate cancers of various Gleason scores, the numbers of each tumor group are shown on the figure. The staining intensity is scored according to 4 scales by 2 pathologists: 0 (no staining), 1 (weak staining), 2 (medium staining) and 3 (strong staining). Scale 0 and 1 are defined as negative staining, while scale 2 and 3 are defined as positive staining. Shown is the percentage of cores that are positively stained for indicated antibodies. E. Shown are clustered patterns of gene expression taken from GSE3325. Columns represent tumor samples (Benign, B1–B6; Primary, P1–P7; Metastatic, M1–M6), and rows represent genes. The heatmap represents higher expression levels in red and lower levels in blue. Expression data for each gene was row normalized. Transcript levels of Siah2, FoxA2, Hes6, Jmjd1a, Plod2, DDC, ChgB, and ENO2 in metastatic PCa are statistically significantly higher than those in primary PCa. See also Figure S6.

Comment in

References

    1. Ahmed AU, Schmidt RL, Park CH, Reed NR, Hesse SE, Thomas CF, Molina JR, Deschamps C, Yang P, Aubry MC, Tang AH. Effect of disrupting seven-inabsentia homolog 2 function on lung cancer cell growth. J Natl Cancer Inst. 2008;100:1606–1629. - PMC - PubMed
    1. Amarilio R, Viukov SV, Sharir A, Eshkar-Oren I, Johnson RS, Zelzer E. HIF1alpha regulation of Sox9 is necessary to maintain differentiation of hypoxic prechondrogenic cells during early skeletogenesis. Development. 2007;134:3917–3928. - PubMed
    1. Aragones J, Fraisl P, Baes M, Carmeliet P. Oxygen sensors at the crossroad of metabolism. Cell Metab. 2009;9:11–22. - PubMed
    1. Arany Z, Huang LE, Eckner R, Bhattacharya S, Jiang C, Goldberg MA, Bunn HF, Livingston DM. An essential role for p300/CBP in the cellular response to hypoxia. Proc Natl Acad Sci U S A. 1996;93:12969–12973. - PMC - PubMed
    1. Beyer S, Kristensen MM, Jensen KS, Johansen JV, Staller P. The Histone Demethylases JMJD1A and JMJD2B Are Transcriptional Targets of Hypoxia-inducible Factor HIF. J Biol Chem. 2008;283:36542–36552. - PMC - PubMed

Publication types

MeSH terms

Substances

Associated data