Review
. 2010 Mar;48(2):213-35, vii.
doi: 10.1016/j.rcl.2010.02.006.

CT angiography: current technology and clinical use

Affiliations
Review

CT angiography: current technology and clinical use

Kanako K Kumamaru et al. Radiol Clin North Am. 2010 Mar.

Abstract

Since 1958, catheter angiography has assumed the role of gold standard for vascular imaging, despite the invasive nature of the procedure. Less invasive techniques for vascular imaging, such as computed tomographic angiography (CTA), have been developed and have matured in conjunction with developments in catheter arteriography. In a few cases, such as imaging, the aorta and the pulmonary arteries, CTA has supplanted catheter angiography as the gold standard. The expanding role of CTA emphasizes the need for deep, broad-based understanding of physical principles. This review describes CT hardware and associated software for angiography. The fundamentals of CTA physics are complemented with several clinical examples.


Figures

Figure 1
Figure 1
Spatial resolution, described in units of line pairs per centimeter, determines the conspicuity of small objects. The ability to resolve the bar pattern gives an estimate of the spatial resolution of a system under prescribed conditions. Higher spatial frequencies allow smaller line pairs to be resolved and therefore will produce a sharper image.
Figure 2
Figure 2
Multisegment reconstruction (Image courtesy of XiangYang Tang, Emory University). For a half-scan reconstruction and monosector reconstruction, data from a single heart beat is acquired over a longer temporal window and used to reconstruct the cardiac image at each Z location. In multisegment reconstruction, data at each Z axis location is acquired from several heartbeats, each with a shorter temporal window and then combined.
Figure 3
Figure 3
Retrospective gating (lower) utilizes a helical acquisition with constant table motion throughout the cardiac cycle. The x-ray output is ramped up and down dependent on the phase of the cardiac cycle. a) Prospective gating, or the step and shoot method (upper), uses an axial acquisition at a predetermined delay time. During the following heart beat, the table is moved to the next location. Each data slab is acquired every other heart beat.
Figure 4
Figure 4
Three dimensional volume rendering of 64 year old man with a saccular aneurysm of the aortic arch, presumed to be a pseudoaneurysm for prior trauma. The shape and location of the aneurysm and extent of calcification are well demonstrated. This form of rendering uses the volumetric nature of the CT acquisition to display a large data set from any spatial orientation. A single view is shown above. Three-dimensional volume rendering is complementary to the evaluation of other post-processed data; it should not be used alone for data interpretation. Volumes are highly desirable to illustrate findings for referring clinicians and can be particularly important for surgical planning .
Figure 5
Figure 5
Axial images from a 79-year-old female with type B aortic dissection and rupture. a) noncontrast, b) 30 seconds after intravenous injection, c) 60 seconds after intravenous injection. The false lumen partially enhances after 30 seconds (solid arrow) with extravasation (open arrow) at the later point of enhancement.
Figure 6
Figure 6
73-year-old man status post axillo-bifemoral bypass graft for an occluded distal aorta. a) Patency of the entire graft is illustrated on a single three-dimensional volume rendered image. b) Sagittal and c) coronal maximum intensity projections demonstrate the occluded distal aorta and mesenteric vessels.
Figure 7
Figure 7
Three-dimensional volume rendered image of 54-year-old male with severe coarctation (arrow). In this patient, the singe image provides a good overview of extensive collaterals through intercostal, internal thoracic, and axillary arteries.
Figure 8
Figure 8
60-year-old female with right aortic arch, coarctation (solid arrow), and saccular pseudoaneurysm (open arrow) before a) and after b) endovascular stent graft placement. Three-dimensional volume rendering provides anatomic mapping for surgical planning as well as post-treatment follow-up. Images of this patient demonstrate how CT has assumed the role of gold standard in aortography. Conventional angiography cannot delineate three-dimensional relationships between structures pre-operatively. It is also invasive and impractical for follow-up. MR aortography typically provides relatively comparable image quality but is limited by susceptibility artifact in many stent graft patients..
Figure 9
Figure 9
85-year-old female, status post endovascular stent repair for an abdominal aortic aneurysm. a) Contrast-enhanced axial image shows enhancement outside of the round stent limbs but within the aneurysm. This is the criteria for an endoleak. b, c) Three-dimensional volume rendered images illustrate the source of the abnormal contrast enhancement; the type II endoleak is shown with flow from the enhanced inferior mesenteric artery (solid arrow) and 5th lumbar arteries (open arrow).
Figure 10
Figure 10
41-year-old male with known Takayasu arteritis. a) axial image at the level of the left ventricle (LV) shows a thickened aortic wall (solid arrow) identified between the iodinated contrast filled lumen (L) and the surrounding lung parenchyma. b) Axial image at the level of the main pulmonary artery (PA) show less prominent thickening of aortic wall plus stenosis of the left pulmonary artery (open arrow).
Figure 11
Figure 11
80-year-old male with dyspnea and clinically suspected pulmonary embolism. a) oblique maximum intensity projection oriented to optimally demonstrate the bifurcation of the main pulmonary artery (PA) shows a saddle-type pulmonary embolism, characterized by filling defects (arrow). b, c) three-dimensional volume rendered images use segmentation to illustrate the extent of the thrombus in yellow.
Figure 12
Figure 12
24-year-old female with known vasculitis. a) Contrast-enhanced axial image shows the stenosis of the right pulmonary artery (solid arrow). b) Three-dimensional volume rendered image (aorta is demonstrated as translucent) enables the visualization of many small collaterals (open arrow) from the bronchial arteries and their relationship to surrounding tissues.
Figure 13
Figure 13
39-year-old man with giant cell arteritis imaged with 320-detector row CT before (top row) and after (bottom row) corticosteroid therapy. A. CTA shows beading and stenosis of the pre-cavernous, cavernous, and supraclinoid portions of the internal carotid artery (arrow head). There is narrowing and irregularity of ophthalmic artery (arrow) that is resolved after treatment (F). B. Three-dimensional volume rendering shows narrowing and beading of parietal branch of the left superficial temporal artery (arrow head), and irregularity of the remaining frontal branch (arrow) that are improved after therapy (G). Note that the patient had prior biopsy of the frontal branch. C., H. (relative cerebral blood volume: rCBV) and D., I. (relative cerebral blood flow: rCBF) maps illustrate a region of decreased perfusion in the left frontal parasagittal region with adjacent hypoperfusion that returned to normal symmetric perfusion after therapy. E. Mean transit time (MTT) map shows left frontal decreased transit time which resolved following treatment (J). Image used with permission .
Figure 14
Figure 14
Three-dimensional volume rendered image for the planning of kidney transplant, showing normal renal arteries. Note the clearly visualized right accessory renal artery.
Figure 15
Figure 15
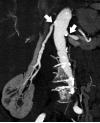
85-year-old female with bilateral renal artery stenosis (arrows). a) Coronal maximum intensity projection focused on the right renal artery. b) Three-dimensional volume rendering also demonstrates the relationship of the renal arteries and the kidneys.
Figure 16
Figure 16
44-year-old female with fibromuscular dysplasia of bilateral renal arteries (arrows). a) Coronal maximum intensity projection and b) three-dimensional volume rendered image have sufficient spatial resolution, showing beaded appearance of proximal renal arteries consistent with the finding on c) catheter angiogram.
Figure 17
Figure 17
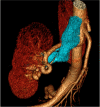
39-year-old female with right renal arteriovenous malformation. a) maximum intensity projection shows early venous filling, an important finding in this diagnosis. b, c) Three-dimensional volume rendered images (venous system is segmented in blue) illustrate the shape and position of tortuous arteries or veins.
Figure 18
Figure 18
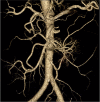
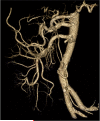
a, b) Three-dimensional volume rendered images in a patient with normal celiac, superior mesenteric artery, and inferior mesenteric artery branches.
Figure 19
Figure 19
84-year-old female with acute abdominal pain. Sagittal maximum intensity projection demonstrates thrombosis with occlusion of the celiac artery with near occlusion of the superior mesenteric artery (arrows).
Figure 20
Figure 20
54-year-old female with abdominal pain and rectal bleeding. Comparison between a) noncontrast and b) contrast-enhanced image shows extravasation of contrast media (arrows) into the lumen of the distal transverse colon, indicating active bleeding. Reformation of the CT data as c) a three-dimensional volume rendering or d) coronal maximum intensity projection shows the high attenuation of the contrast indicating hemorrhage (arrows).
Figure 21
Figure 21
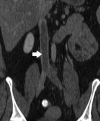
50-year-old male with abdominal pain and high clinical suspicion for median arcuate ligament compression (arrow). a) Sagittal maximum intensity projection and b) three-dimensional volume rendering are essential to detail the relationship between the compressed celiac axis and the aorta. Note the normal superior mesenteric artery, a characteristic finding in these patients.
Figure 22
Figure 22
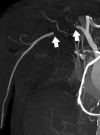
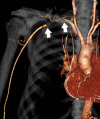
91-year-old male with right shoulder and arm pain. Upper extremity CTA displayed as a) maximum intensity projection and b) three-dimensional volume rendering shows acute subclavian artery thrombosis (arrows). Patients with more longstanding obstruction are expected to have more collateral flow.
Figure 23
Figure 23
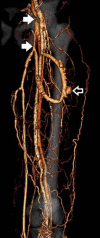
38-year-old male with left thigh arterio-venous hemodialysis graft. Three-dimensional volume rendering shows stenosis (solid arrows) in the left saphenous and femoral veins cranial to the anastomosis. There is a small graft aneurysm (open arrow).
Figure 24
Figure 24
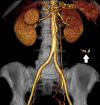
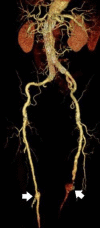
82-year-old male status post endovascular stent graft placement. Note that the tortured bilateral iliac and femoral arteries with distal aneurysms (arrows) are well visualized on three-dimensional volume rendered image.
Figure 25
Figure 25
39-year-old female with extensive thrombus in inferior vena cava. a) Contrast-enhanced axial image shows the filling defect in inferior vena cava (arrow). b) Coronal maximum intensity projection can depict long segments of thrombus (arrow).
Figure 26
Figure 26
Three-dimensional volume rendering of 58-year-old male with varicose veins. CT venography provides the interventionalist with a comprehensive view of the varicose veins (segmented in blue) with clear anatomic landmarks such as muscle and bone.

Similar articles

Cited by

References

    1. Fleischmann D, Rubin GD. Quantification of intravenously administered contrast medium transit through the peripheral arteries: implications for CT angiography. Radiology. 2005;236(3):1076–1082. - PubMed
    1. Ligon BL. Biography: history of developments in imaging techniques: Egas Moniz and angiography. Semin Pediatr Infect Dis. 2003;14(2):173–181. - PubMed
    1. Mueller RL, Sanborn TA. The history of interventional cardiology: cardiac catheterization, angioplasty, and related interventions. Am Heart J. 1995;129(1):146–172. - PubMed
    1. Waugh JR, Sacharias N. Arteriographic complications in the DSA era. Radiology. 1992;182(1):243–246. - PubMed
    1. Scoutt LM, Zawin ML, Taylor KJ. Doppler US. Part II. Clinical applications. Radiology. 1990;174(2):309–319. - PubMed

MeSH terms