. 2010 Dec 22;277(1701):3809-17.
doi: 10.1098/rspb.2010.1052. Epub 2010 Jul 7.

Why genes overlap in viruses

Affiliations

Why genes overlap in viruses

Nicola Chirico et al. Proc Biol Sci. .

Abstract

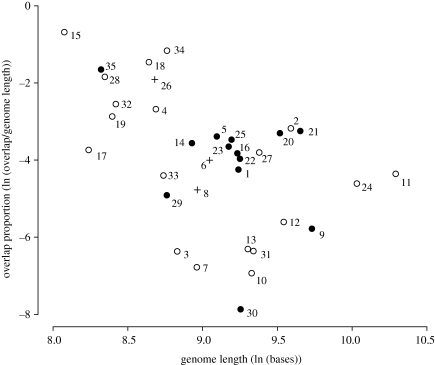
The genomes of most virus species have overlapping genes--two or more proteins coded for by the same nucleotide sequence. Several explanations have been proposed for the evolution of this phenomenon, and we test these by comparing the amount of gene overlap in all known virus species. We conclude that gene overlap is unlikely to have evolved as a way of compressing the genome in response to the harmful effect of mutation because RNA viruses, despite having generally higher mutation rates, have less gene overlap on average than DNA viruses of comparable genome length. However, we do find a negative relationship between overlap proportion and genome length among viruses with icosahedral capsids, but not among those with other capsid types that we consider easier to enlarge in size. Our interpretation is that a physical constraint on genome length by the capsid has led to gene overlap evolving as a mechanism for producing more proteins from the same genome length. We consider that these patterns cannot be explained by other factors, namely the possible roles of overlap in transcription regulation, generating more divergent proteins and the relationship between gene length and genome length.


Figures

Figure 1.
Figure 1.
Predicted capsid volume increases in moving up to the nearest available T number compared with genome length for some DNA viruses. For further details see §2.
Figure 2.
Figure 2.
Relationship between overlap proportion (the proportion of the genome that is within an overlap) and total genome length for RNA virus families, both expressed as natural logarithms. Points are means for the following taxa, all of which have at least one well-curated genome and some gene overlap. Open circles are families with icosahedral capsids; closed circles have flexible capsids; crosses are families with indeterminate capsid forms. Linear regression, r2 = 0.24, p = 0.003. (1) Arenaviridae (n = 2); (2) Arteriviridae (n = 3); (3) Astroviridae (n = 4); (4) Birnaviridae (n = 3); (5) Bornaviridae (n = 1); (6) Bromoviridae (n = 9); (7) Caliciviridae (n = 9); (8) Caulimoviridae (n = 7); (9) Closteroviridae (n = 7); (10) Comoviridae (n = 7); (11) Coronaviridae (n = 9); (12) Cystoviridae (n = 3); (13) Flaviviridae (n = 26); (14) Flexiviridae (n = 22); (15) Hepadnaviridae (n = 1); (16) Hordeivirus (n = 1); (17) Leviviridae (n = 6); (18) Luteoviridae (n = 8); (19) Nodaviridae (n = 2); (20) Orthomyxoviridae (n = 1); (21) Paramyxoviridae (n = 3); (22) Pecluvirus (n = 1); (23) Potyviridae (n = 60); (24) Reoviridae (n = 16); (25) Retroviridae (n = 11); (26) Schizochytrium single-stranded RNA virus (n = 1); (27) Sclerophthora macrospora virus A (n = 1); (28) Sequiviridae (n = 2); (29) Sobemovirus (n = 9); (30) Tobamovirus (n = 6); (31) Tobravirus (n = 1); (32) Togaviridae (n = 9); (33) Tombusviridae (n = 9); (34) Totiviridae (n = 3); (35) Tymoviridae (n = 5); (36) Umbravirus (n = 2).
Figure 3.
Figure 3.
Relationship between overlap proportion and total genome length for DNA virus families. See figure 2 legend for explanation of symbols. Linear regression r2 = 0.39, p < 0.001. (1) Adenoviridae (n = 12); (2) Anellovirus (n = 1); (3) Bacillus phage GIL16c (n = 1); (4) Baculoviridae (n = 1); (5) Circoviridae (n = 3); (6) Corticovirus (n = 1); (7) Fuselloviridae (n = 3); (8) Geminiviridae (n = 82); (9) Geobacillus phage GBSV1 (n = 1); (10) Herpesviridae (n = 26); (11) Inoviridae (n = 18); (12) Iridoviridae (n = 1); (13) Lipothrixviridae (n = 2); (14) Microviridae (n = 13); (15) Myoviridae (n = 35); (16) Papillomaviridae (n = 13); (17) Parvoviridae (n = 8); (18) Phycodnaviridae (n = 1); (19) Plasmaviridae (n = 1); (20) Podoviridae (n = 32); (21) Polyomaviridae (n = 2); (22) Poxviridae (n = 7); (23) Salmonella phage ST64B (n = 1); (24) Siphoviridae (n = 106); (25) Tectiviridae (n = 1); (26) Xanthomonas phage OP2 (n = 1). The outlier represents the four base pair overlap in Acholeplasma phage L2 (RefSeq NC_001447).
Figure 4.
Figure 4.
Relationship between overlap proportion and mutation rate. Open circles are family means for DNA viruses, closed circles are family means for RNA viruses. The negative infinity value represents families without overlap (all values are logarithmically transformed).

References

    1. Agranovsky A. A.1996The principles of molecular organization, expression and evolution of closteroviruses: over the barriers. Adv. Virus Res. 47, 119–15810.1016/S0065-3527(08)60735-6 (doi:10.1016/S0065-3527(08)60735-6) - DOI - DOI - PMC - PubMed
    1. Ahlquist P.2005Virus evolution: fitting lifestyles to a T. Curr. Biol. 15, R465–R46710.1016/j.cub.2005.06.016 (doi:10.1016/j.cub.2005.06.016) - DOI - DOI - PubMed
    1. Baker T. S., Olson N. H., Fuller S. D.1999Adding the third dimension to virus life cycles: three-dimensional reconstruction of icosahedral viruses from cryo-electron micrographs. Microbiol. Mol. Biol. Rev. 63, 862–922 - PMC - PubMed
    1. Bamford D. H., Grimes J. M., Stuart D. I.2005What does structure tell us about virus evolution? Curr. Opin. Struct. Biol. 15, 655–66310.1016/j.sbi.2005.10.012 (doi:10.1016/j.sbi.2005.10.012) - DOI - DOI - PubMed
    1. Barrell B. G., Air G. M., Hutchison C. A.1976Overlapping genes in bacteriophage-φχ174. Nature 264, 34–4110.1038/264034a0 (doi:10.1038/264034a0) - DOI - DOI - PubMed

Publication types

LinkOut - more resources