. 2010 Sep;84(18):9546-56.
doi: 10.1128/JVI.00823-10. Epub 2010 Jul 7.

Remarkable lethal G-to-A mutations in vif-proficient HIV-1 provirus by individual APOBEC3 proteins in humanized mice

Affiliations

Remarkable lethal G-to-A mutations in vif-proficient HIV-1 provirus by individual APOBEC3 proteins in humanized mice

Kei Sato et al. J Virol. 2010 Sep.

Abstract

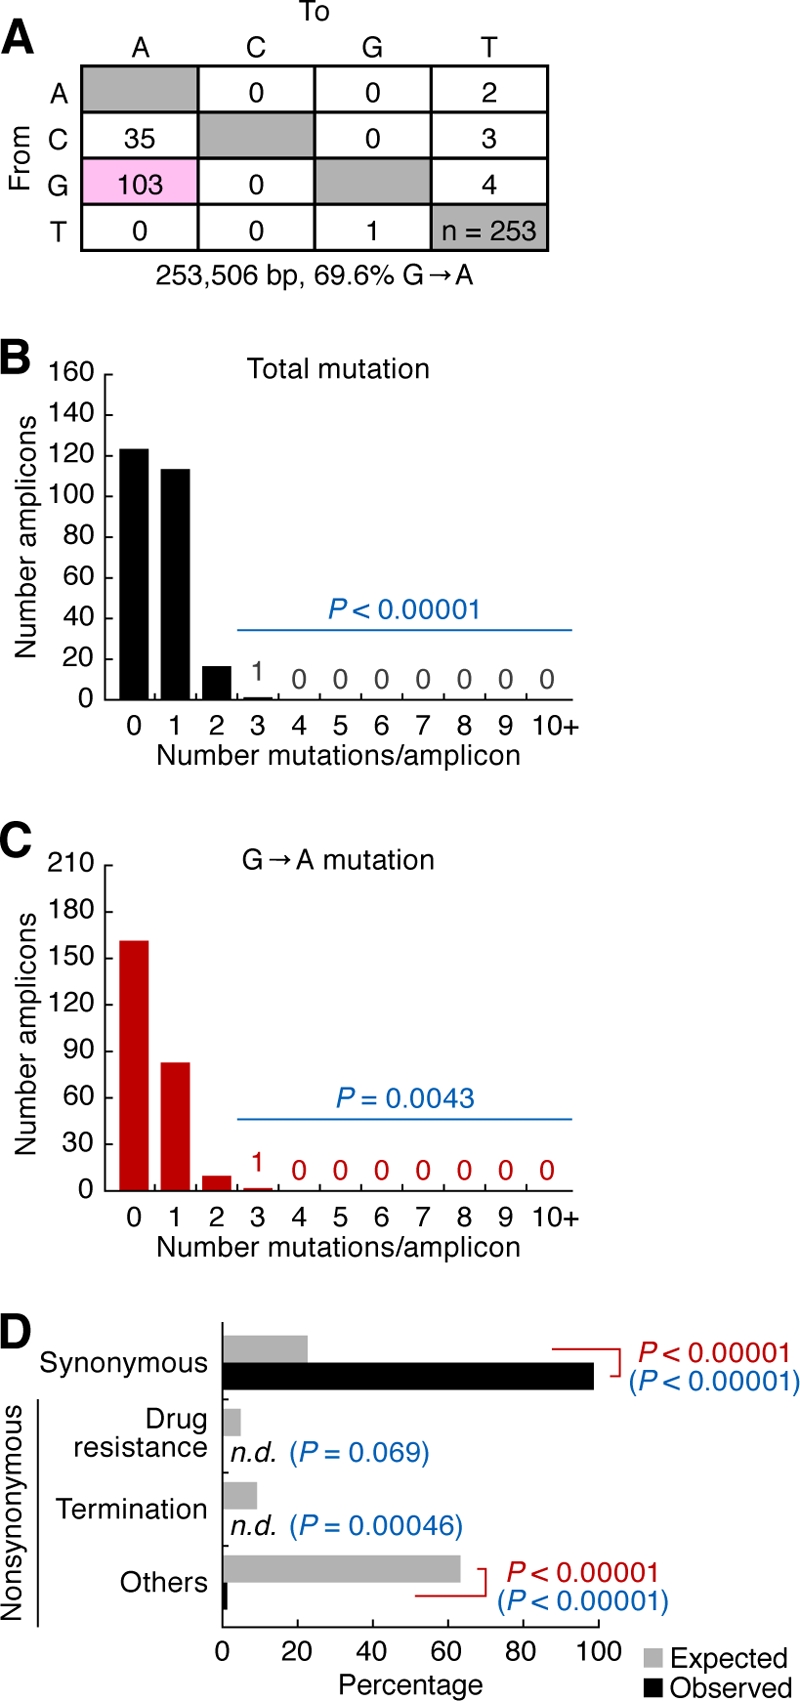
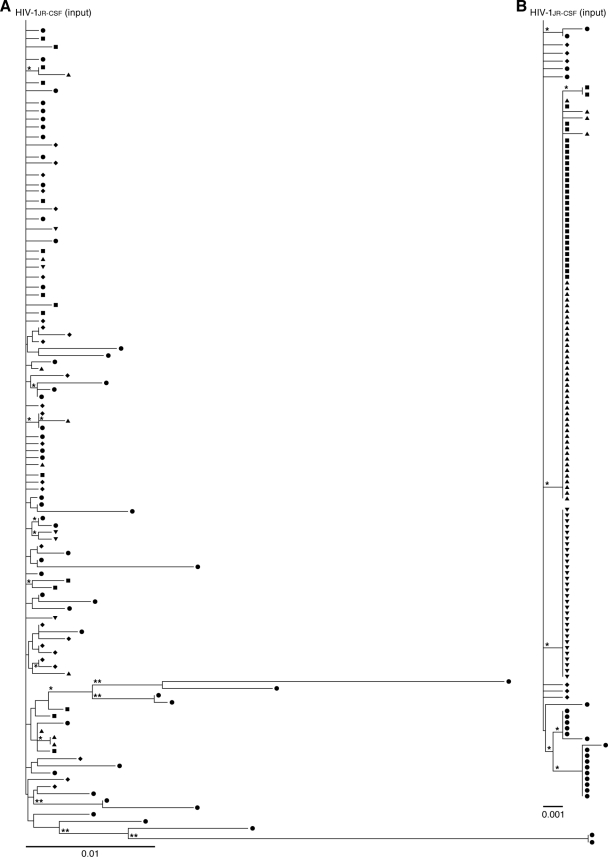
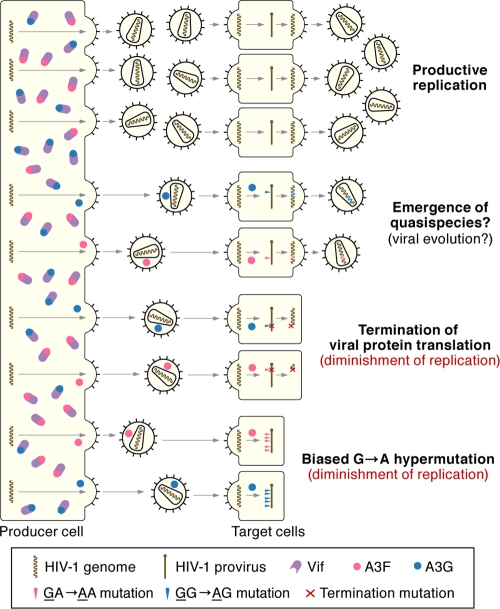
Genomic hypermutation of RNA viruses, including human immunodeficiency virus type 1 (HIV-1), can be provoked by intrinsic and extrinsic pressures, which lead to the inhibition of viral replication and/or the progression of viral diversity. Human APOBEC3G was identified as an HIV-1 restriction factor, which edits nascent HIV-1 DNA by inducing G-to-A hypermutations and debilitates the infectivity of vif-deficient HIV-1. On the other hand, HIV-1 Vif protein has the robust potential to degrade APOBEC3G protein. Although subsequent investigations have revealed that lines of APOBEC3 family proteins have the capacity to mutate HIV-1 DNA, it remains unclear whether these endogenous APOBEC3s, including APOBEC3G, contribute to mutations of vif-proficient HIV-1 provirus in vivo and, if so, what is the significance of these mutations. In this study, we use a human hematopoietic stem cell-transplanted humanized mouse (NOG-hCD34 mouse) model and demonstrate the predominant accumulation of G-to-A mutations in vif-proficient HIV-1 provirus displaying characteristics of APOBEC3-mediated mutagenesis. Notably, the APOBEC3-associated G-to-A mutation of HIV-1 DNA that leads to the termination of translation was significantly observed. We further provide a novel insight suggesting that HIV-1 G-to-A hypermutation is independently induced by individual APOBEC3 proteins. In contrast to the prominent mutation in intracellular proviral DNA, viral RNA in plasma possessed fewer G-to-A mutations. Taken together, these results provide the evidence indicating that endogenous APOBEC3s are associated with G-to-A mutation of HIV-1 provirus in vivo, which can result in the abrogation of HIV-1 infection.


Figures

FIG. 1.
FIG. 1.
Relevance of endogenous A3s and Vif in humanized mice. (A) Comparison of the expression levels of A3 genes in CD4+ T cells from humans and the humanized mice. Human CD4+ T cells in PBMCs of humans (n = 7) and those in the spleen of the humanized mice (n = 6) were isolated. The expression levels of A3B, A3C, A3DE, A3F, and A3G were analyzed by real-time RT-PCR and were normalized to GAPDH. (B) Infectivities of WT and vif-deficient HIV-1. WT and vif-deficient HIV-1JR-CSF were prepared as described in Materials and Methods and were inoculated into TZM-bl indicator cells. The infectivities of these viruses were quantified as described in Materials and Methods and were normalized to the amount of p24. The assay was performed in triplicate, and a representative result is shown. (C) In vitro replication of WT and vif-deficient HIV-1. WT and vif-deficient HIV-1JR-CSF were inoculated into the activated human T cells isolated from the spleen of humanized mice. The culture supernatants were routinely harvested, and the amount of p24 was quantified by ELISA. The assay was performed in triplicate, and a representative result is shown. (D) Longitudinal analysis of HIV-1 replication in humanized mice. WT (n = 15) and vif-deficient (n = 6) HIV-1JR-CSF were inoculated into 12- to 13-week-old humanized mice, and the amount of HIV-1 RNA in plasma was routinely analyzed. The horizontal broken line indicates the detection limit of the assay (40 copies/ml). (E and F) The levels of HIV-1 DNA and HIV-1-infected cells in spleen. The copy number of HIV-1 DNA in 105 splenic human MNCs of WT (n = 7) and vif-deficient (n = 4) HIV-1JR-CSF-infected mice (E) and the percentage of HIV-1 p24-positive cells in splenic human MNCs of WT (n = 6) and vif-deficient (n = 5) HIV-1JR-CSF-infected mice and mock-infected mice (n = 4) (F) were determined. (G) Proportion of peripheral CD4+ cells. The percentages of whole CD4+ cells, naïve CD4+ cells, and memory CD4+ cells in human CD45+ leukocytes of WT (n = 15) and vif-deficient (n = 6) HIV-1JR-CSF-infected mice and mock-infected mice (n = 14) were routinely analyzed. Asterisks indicate statistically significant differences from the value of WT HIV-1 (P < 0.05 by Student's t test). Error bars represent SEMs. AU, arbitrary unit; Dpi, days postinfection; Wpi, weeks postinfection; n.d., not detected; n.s., no statistical significance.
FIG. 2.
FIG. 2.
Preferential G-to-A mutation in HIV-1 provirus in vivo. (A) Mutation of HIV-1 provirus in humanized mice. The pol region of HIV-1 proviral DNA (1,002 bp, nucleotides 2620 to 3621) was cloned and sequenced, and the mutation matrix is shown. (B) Preference of G-to-A mutation sites. The 227 detected G-to-A mutation sites were classified according to the nucleotides positioned between −5 and +5 from the detected G-to-A mutation sites (position 0). The result obtained (Observed) was compared to the result expected if G-to-A mutation were stochastically induced (Expected). Statistical differences between the obtained and the expected results in each position were determined by the χ2 test for independence. (C) Classification of the effect of G-to-A mutation on HIV-1 replication. The 221 G-to-A mutations detected in A3 contexts were sorted into synonymous and nonsynonymous mutations. Nonsynonymous mutations were further classified into termination mutations, drug resistance-associated mutations, and missense mutations (Others). The obtained result (Observed) was compared to the result expected if G-to-A mutation were stochastically induced (Expected). Statistical differences between the obtained and the expected results were determined by the χ2 test for independence.
FIG. 3.
FIG. 3.
Functional property of Vif in the infected mice. (A) Expression of vif in WT HIV-1-infected mice. The expression of vif in the splenic human MNCs of 5 WT HIV-1-infected mice used for sequencing analysis (lanes 1 to 5) and that of a mock-infected mouse (lane 6) were analyzed by RT-PCR. GAPDH was used as the positive control of the assay. The mouse numbers correspond with those in Table 1. (B) Diversity of vif coding sequences in the infected mice. The coding sequences of vif (579 nucleotides, nucleotides 5053 to 5631) were cloned and sequenced, and the distribution of the predominant sequences is shown as the percentage of all sequences (86 amplicons). Nucleotide substitutions (left) and amino acid substitutions (right) are represented. Note that C540T is a synonymous substitution. (C) Evaluation of the ability of mutated Vif to counteract A3G. Four kinds of nonsynonymously mutated (M29I, I31S, G126R, and A137V) Vif-expressing plasmids, WT Vif-expressing plasmid, and the parental plasmid (Vector) were cotransfected with a vif-deficient HIV-1-producing plasmid (pJR-CSFΔvif) into HA-A3G-expressing HEK293T cells. The infectivity of HIV-1 virions released from cotransfected cells is shown as the percentage of that from WT Vif-cotransfected cells (bottom). The amount of released HIV-1 virions (p24) and that of A3G in the released virions were analyzed by Western blotting (top). The assay was performed in triplicate, and a representative result is shown. Error bars represent SEMs.
FIG. 4.
FIG. 4.
Biased G-to-A mutation in HIV-1 provirus in vivo. (A and B) The extent of mutation in each amplicon of proviral DNA. The number of whole mutations (A) and that of G-to-A mutations (B) within each amplicon (n = 253) are shown. (C and D) The accumulation of either GA-to-AA or GG-to-AG hypermutations within an amplicon. (C) The 23 amplicons that possessed more than 2 G-to-A mutations were sorted by the respective nucleotide next to the detected G-to-A site. The percentage of the type of nucleotides following G-to-A sites in whole G-to-A sites within each amplicon (shown as “% of total G→A mutations” on x axis) was calculated and was further classified into 6 grades (0, 1 to 20, 21 to 40, 41 to 60, 61 to 80, and 81 to 100%). Horizontal broken lines in the graphs of GA→AA and GG→AG (only in 81 to 100%) represent the values expected if G-to-A mutations are stochastically induced. Asterisks indicate statistically significant differences (P < 0.05 by χ2 test for independence) between the obtained and the expected values. (D) Representatives of the amplicons harboring biased G-to-A hypermutations. The sequences of 2 GA-to-AA-biased (top) and 2 GG-to-AG-biased (bottom) amplicons are illustrated. The numbers of GA-to-AA sites (top), GG-to-AG sites (bottom), and total G-to-A mutation sites within the sequenced pol region (1,002 nucleotides) are presented at the right of each sequence. Note that GC-to-AC and GT-to-AT mutations were not detected in the 4 amplicons.
FIG. 5.
FIG. 5.
Few G-to-A mutations in HIV-1 viral RNA in vivo. (A) Mutation of HIV-1 RNA in humanized mice. The pol region of HIV-1 viral RNA (1,002 bp, nucleotides 2620 to 3621) was cloned and sequenced, and the mutation matrix is shown. (B and C) The extent of mutation in each amplicon of viral RNA. The number of whole mutations (B) and that of G-to-A mutations (C) within each amplicon (n = 253) are shown. Statistical differences between the number of viral RNA amplicons possessing more than 3 mutations and that of proviral DNA were determined by the χ2 test for independence. (D) Classification of A3-associated G-to-A mutations in viral RNA. The 75 G-to-A mutations detected in A3 contexts were sorted into synonymous and nonsynonymous mutations. Nonsynonymous mutations were further classified into termination mutations, drug resistance-associated mutations, and missense mutations (Others). The result obtained (Observed) was compared to the result expected if G-to-A mutation were stochastically induced (Expected). Statistical differences between the value obtained in viral RNA from the expected results (indicated in red) and the value in proviral DNA (indicated in blue with parentheses) were determined by the χ2 test for independence. n.d., not detected.
FIG. 6.
FIG. 6.
Phylogeny of proviral DNA and viral RNA in 5 WT HIV-1-infected mice. Maximum likelihood trees of the 1,002-bp pol region of HIV-1 proviral DNA (A) and viral RNA (B) are shown. Each symbol represents the result from respective infected mice (n = 5). The scale bars indicate the numbers of substitutions per site. Bootstrap values are shown as follows: *, >50%; **, >80%.
FIG. 7.
FIG. 7.
A possible model for the biased G-to-A mutation in HIV-1 in vivo. The dynamics of HIV-1 replication accompanying G-to-A mutagenesis of HIV-1 DNA by A3s are illustrated. (i) The mechanism of action of endogenous A3s. In the presence of Vif, the ability of almost all of the A3 proteins (A3G and A3F) is counteracted by Vif through the proteasome-dependent degradation pathway. Nevertheless, a fraction of A3s that evaded Vif-mediated degradation would be incidentally incorporated into a virion and individually cause the biased G-to-A mutation of HIV-1 reverse-transcribed DNA in the respective infected cells. For instance, A3G induces GG-to-AG-biased mutation, whereas A3F contributes to GA-to-AA-biased mutagenesis (bottom). (ii) The effect of endogenous A3s on HIV-1 expansion in vivo. Along with productive replication (top), sublethal G-to-A mutation by endogenous A3s may have been associated with the emergence of HIV-1 quasispecies, leading to viral diversity and evolutionary change (upper middle). In addition, partial G-to-A mutation by intrinsic A3s can significantly evoke the termination mutation (e.g., TGG to TAG), which results in the diminishment of viral replication (lower middle), as well as the tremendous and lethal G-to-A hypermutation (bottom).

Similar articles

Cited by

References

    1. Albin, J. S., and R. S. Harris. 2010. Interactions of host APOBEC3 restriction factors with HIV-1 in vivo: implications for therapeutics. Expert Rev. Mol. Med. 12:e4. - PMC - PubMed
    1. Bishop, K. N., R. K. Holmes, A. M. Sheehy, N. O. Davidson, S. J. Cho, and M. H. Malim. 2004. Cytidine deamination of retroviral DNA by diverse APOBEC proteins. Curr. Biol. 14:1392-1396. - PubMed
    1. Chelico, L., P. Pham, and M. F. Goodman. 2009. Mechanisms of APOBEC3G-catalyzed processive deamination of deoxycytidine on single-stranded DNA. Nat. Struct. Mol. Biol. 16:454-455. - PMC - PubMed
    1. Chiu, Y. L., and W. C. Greene. 2008. The APOBEC3 cytidine deaminases: an innate defensive network opposing exogenous retroviruses and endogenous retroelements. Annu. Rev. Immunol. 26:317-353. - PubMed
    1. Cullen, B. R. 2006. Role and mechanism of action of the APOBEC3 family of antiretroviral resistance factors. J. Virol. 80:1067-1076. - PMC - PubMed

Publication types

Substances

LinkOut - more resources