. 2010 Jul 7;30(27):9189-98.
doi: 10.1523/JNEUROSCI.1603-10.2010.

Neuronal correlates of memory formation in motor cortex after adaptation to force field

Affiliations

Neuronal correlates of memory formation in motor cortex after adaptation to force field

Fritzie Arce et al. J Neurosci. .

Abstract

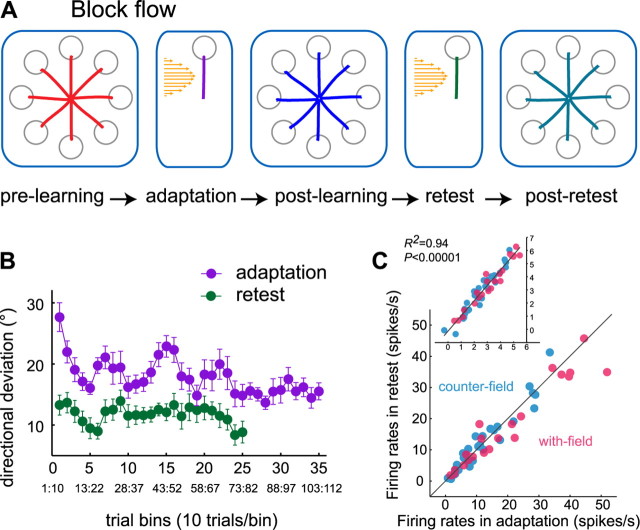
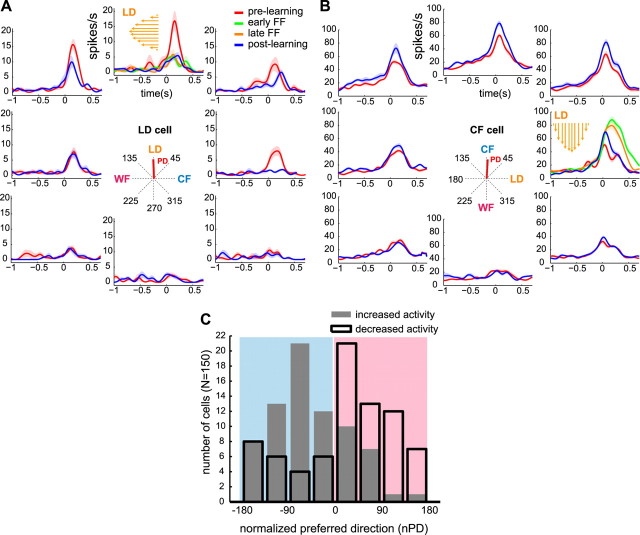
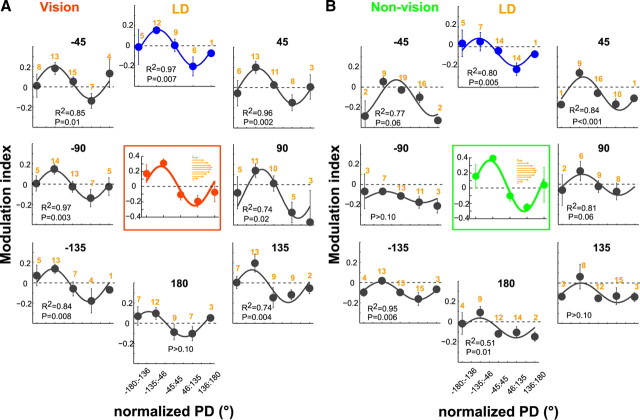
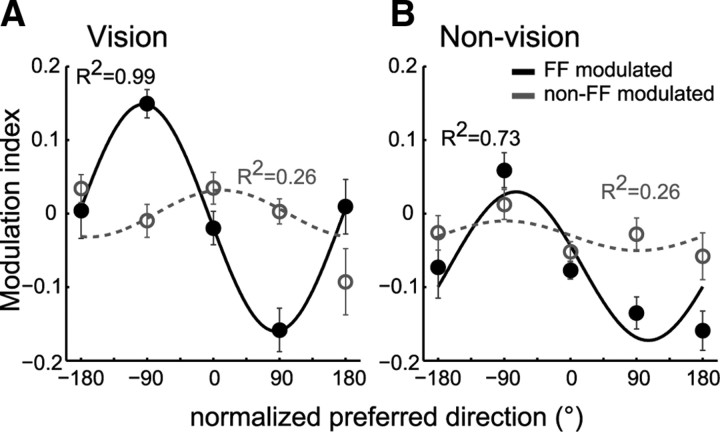
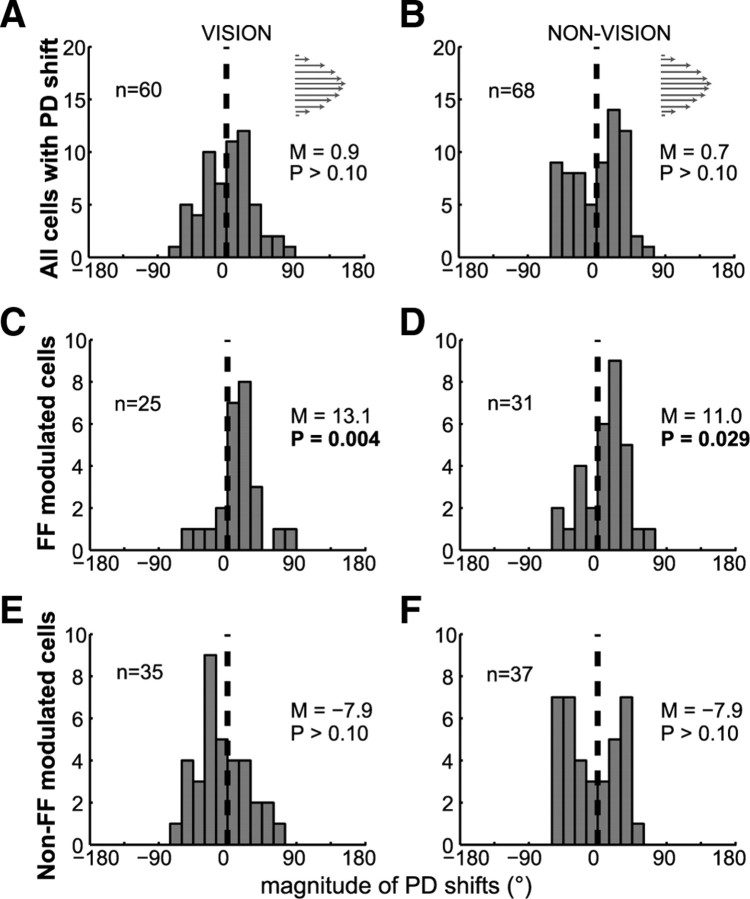
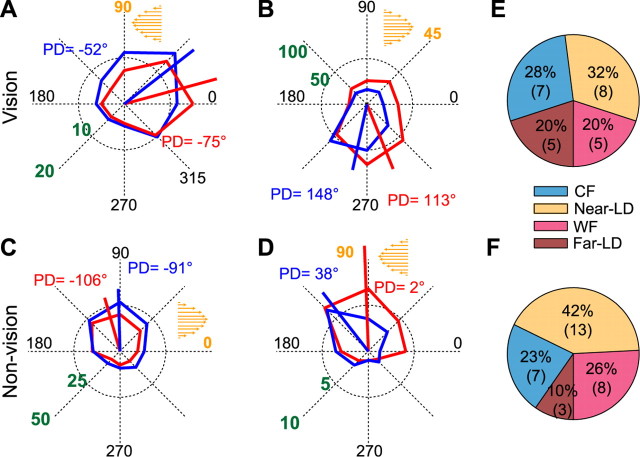
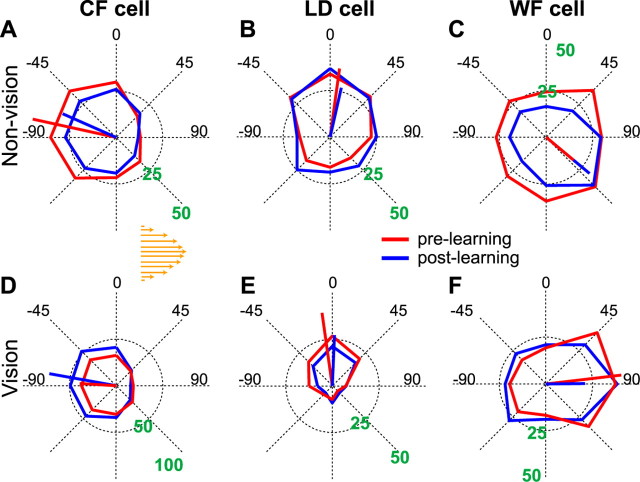
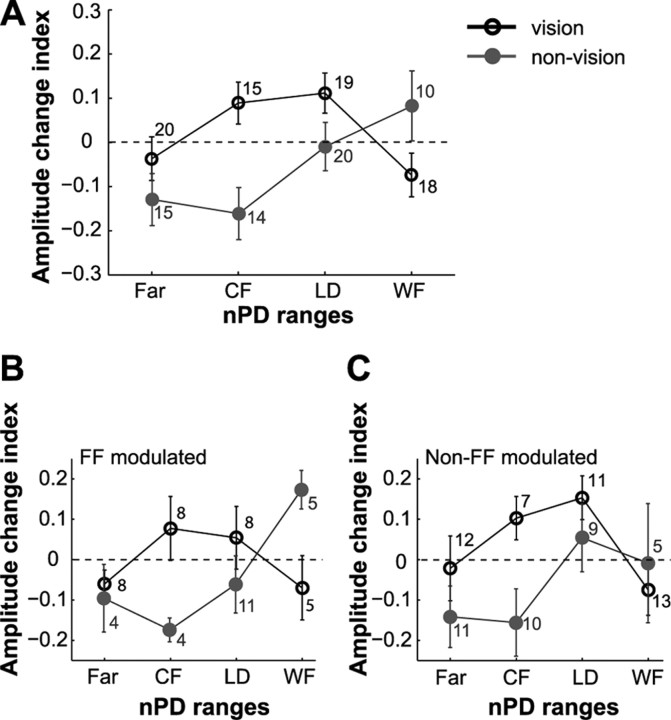
Activity of single neurons in the motor cortex has been shown to change during acquisition of motor skills. We previously reported that the combined activity of cell ensembles in the motor cortex of monkeys (Macaca fascicularis) evolves during adaptation to a novel force field perturbation to encode the direction of compensatory force when reaching to visual targets. We also showed that the population directional signal was altered by the available sensory feedback. Here, we examined whether traces of such activity would linger on to later constitute motor memories of the newly acquired skill and whether memory traces would differ depending on feedback. We found that motor-cortical cell ensembles retained features of their adaptive activity pattern in the absence of perturbation when reaching to both learned and unlearned targets. Moreover, the preferred directions of these cells rotated in the direction of force field while the entire population of cells produced no net rotation of preferred direction when returning to null-field reaches. Whereas the activity pattern and preferred direction rotations were comparable with and without visual feedback, changes in tuning amplitudes differed across feedback conditions. Last, savings in behavioral performance and neuronal activity during later reexposure to force field were apparent. Overall, the findings reflect a novel representation of motor memory by cell ensembles and indicate a putative role of the motor cortex in early acquisition of motor memory.


Figures

Figure 1.
Figure 1.
Retest after force field learning. A, Daily sessions consisted of five trial blocks: prelearning, adaptation, postlearning, retest, and post-retest. B, Mean initial directional deviations during force field adaptation (violet) and retest (green) across sessions with retest block. The vertical bars denote ±1 SE. Each point corresponds to mean values across 10 trials. Binning was done by moving three trials forward (see smaller numbers below the trial bin number). C, Correlation between the firing rates during adaptation and retest, averaged across the first 20 trials. Shown for cells with R2 > 0.70. Color coding according to the nPD of the cells that were similar (with-field) or opposite (counterfield) to the direction of force field. The diagonal line marks the unity. The inset shows Box-Cox transformed data in C and the regression fit.
Figure 2.
Figure 2.
Changes in the activity of M1 neurons after adaptation to force field. A, B, PETHs (and ±1 SE) smoothed by a 50 ms Gaussian kernel during prelearning (red) and postlearning (blue) reaches to eight directions and during early (green) and late (orange) force field reaches to targets at 90 and 0° (subplots with orange arrows indicating FF direction). PETHs are aligned at movement onset (0 s). Example of a “LD cell” whose actual PD (central plot, red line) is 2° from the LD (A) and a “CF cell” whose actual PD (red line) is −87° from the LD and opposite to the clockwise force field (B). The PD of the neuron in A shifted (15°) from prelearning to postlearning, whereas the tuning amplitude of the neuron in B increased (permutation test, p < 0.05). C, Histogram shows the number of FF-modulated cells (y-axis) that increased (gray-filled) or decreased (black) their postlearning activity according to the normalized preferred direction (x-axis). The color-shaded areas denote cells with nPD opposite (cyan) or similar (magenta) to the FF direction. Data combine similar results in both feedback conditions.
Figure 3.
Figure 3.
Retained coactivation of cell ensembles after adaptation to force fields with visual feedback (A) and without (B). The postlearning pattern is shown in the radial plots, and the adaptive pattern (recorded during FF adaptation) is shown in the central boxed plots. Note that the central plot and the radial plots are quite similar (see text for analysis). Radial plots: For each panel, the eight radial plots correspond to target directions organized according to the distance from the LD and the FF direction (i.e., positive directions correspond to directions similar to FF, whereas negative directions correspond to directions opposite to FF). This was done to pool the data across all recording sessions with varying LD and FF direction. Each radial plot relates the population modulation indexes (y-axis, mean ±1 SE) to the nPD, which corresponds to the angular distance of the PD of the cells from the LD (x-axis, shown in ranges). Cosine-fit on the population modulation index, significant R2, and corresponding p level are shown (cosine-fit significance set at p < 0.05). The orange numbers on top of the cosine-fit denote the number of cells in each nPD range. Data include cells that were modulated by force field in the late adaptation phase and had significant rate differences between prelearning and postlearning. Central plots: For each panel, the central plot corresponds to the learned target direction. It relates the population modulation index (i.e., rate changes between prelearning and adaptation blocks) to the nPD as shown in the radial plots.
Figure 4.
Figure 4.
Postlearning pattern differs between force field-modulated and non-force field-modulated cells. Modulation indexes per nPD range were averaged across all target directions in vision (A) and nonvision (B) conditions and separately for FF-modulated (black) and non-FF-modulated cells (gray). Corresponding cosine-fits and R2 are shown. Error bars denote ±1 SE.
Figure 5.
Figure 5.
Preferred direction shifts in the population of force field-modulated cells. A, B, Distribution of all cells with significant PD shifts during the movement epoch of the vision and nonvision conditions. C–F, As in A and B, shown separately for FF-modulated (C, D) and non-FF-modulated (E, F) cells. Mean PD shifts (M) and p levels are also shown. n denotes the number of cells in each condition; the arrows indicate FF direction.
Figure 6.
Figure 6.
Reorganization of preferred directions during the movement epoch. A–D, Polar plots of mean firing rates of single units that significantly shifted their PDs from prelearning (red line) to postlearning (blue line). Normalized PD corresponding to the prelearning (red number) and postlearning (blue number) blocks are shown. The orange arrows indicate learned FF direction. Green numbers on the radius denote firing rates (spikes/second). E, F, Proportion of FF-modulated cells per nPD range that showed significant PD shifts.
Figure 7.
Figure 7.
Tuning amplitude of M1 neurons changes after learning. Polar plots of movement-related activity of FF-modulated cells during prelearning (red) and postlearning (blue). Cell examples from different nPD ranges of nonvision (A–C) and vision (D–F) conditions. The prelearning and postlearning PDs (red and blue lines, respectively) correspond to the PD distance from the LD (0°) and for a clockwise force field (orange arrows). PD shift was also found significant in A and E, but not in B–D and F. The green numbers on the radius denote firing rates (spikes/second).
Figure 8.
Figure 8.
Postlearning changes in tuning amplitude differ across nPD ranges and feedback. A, Mean amplitude change indexes as a function of the nPD ranges. Shown for the movement epoch of the population of cells that showed significant amplitude change for vision (black) and nonvision (gray). B, C, Data in A separated into FF-modulated and non-FF-modulated cells, respectively. The number of cells in each nPD range is shown. The vertical bars denote ±1 SE.

References

    1. Arce F, Novick I, Shahar M, Link Y, Ghez C, Vaadia E. Differences in context and feedback result in different trajectories and adaptation strategies in reaching. PLoS ONE. 2009;4:e4214. - PMC - PubMed
    1. Arce F, Novick I, Mandelblat-Cerf Y, Israel Z, Ghez C, Vaadia E. Combined adaptiveness of specific motor cortical ensembles underlies learning. J Neurosci. 2010;30:5415–5425. - PMC - PubMed
    1. Attwell PJ, Cooke SF, Yeo CH. Cerebellar function in consolidation of a motor memory. Neuron. 2002;34:1011–1020. - PubMed
    1. Baraduc P, Lang N, Rothwell JC, Wolpert DM. Consolidation of dynamic motor learning is not disrupted by rTMS of primary motor cortex. Curr Biol. 2004;14:252–256. - PubMed
    1. Dave AS, Margoliash D. Song replay during sleep and computational rules for sensorimotor vocal learning. Science. 2000;290:812–816. - PubMed

Publication types