. 2010 Jul 7;30(27):9260-70.
doi: 10.1523/JNEUROSCI.1590-10.2010.

Active roles of electrically coupled bipolar cell network in the adult retina

Affiliations

Active roles of electrically coupled bipolar cell network in the adult retina

Itaru Arai et al. J Neurosci. .

Abstract

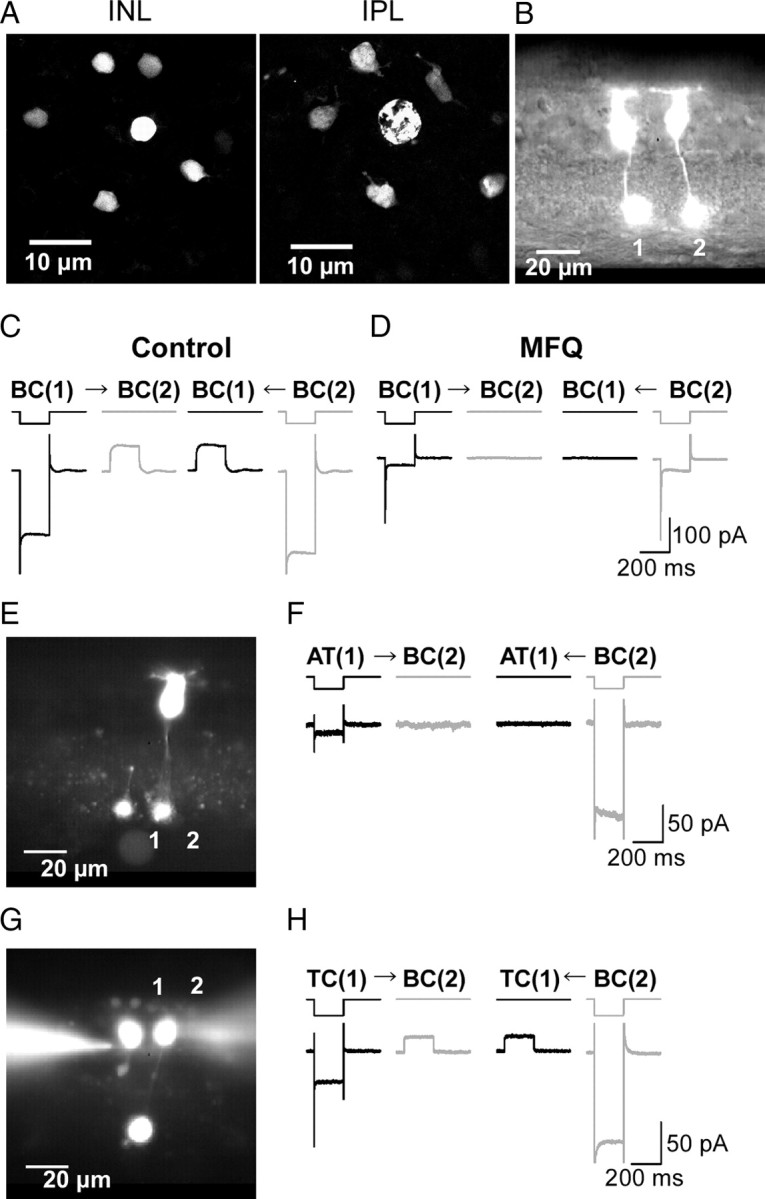
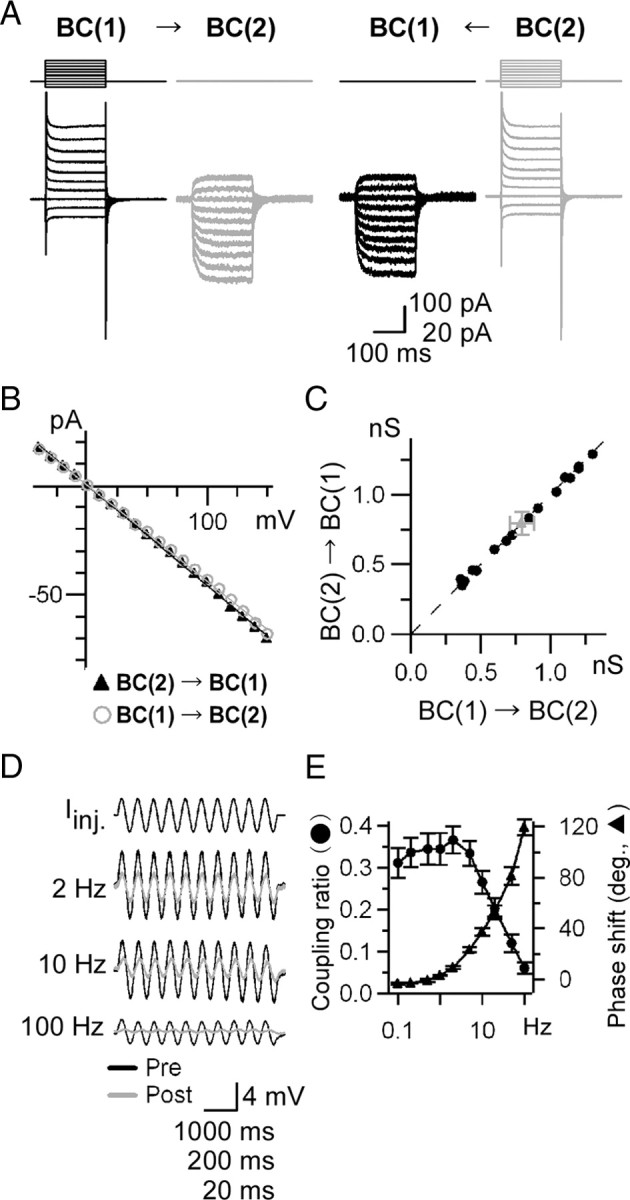
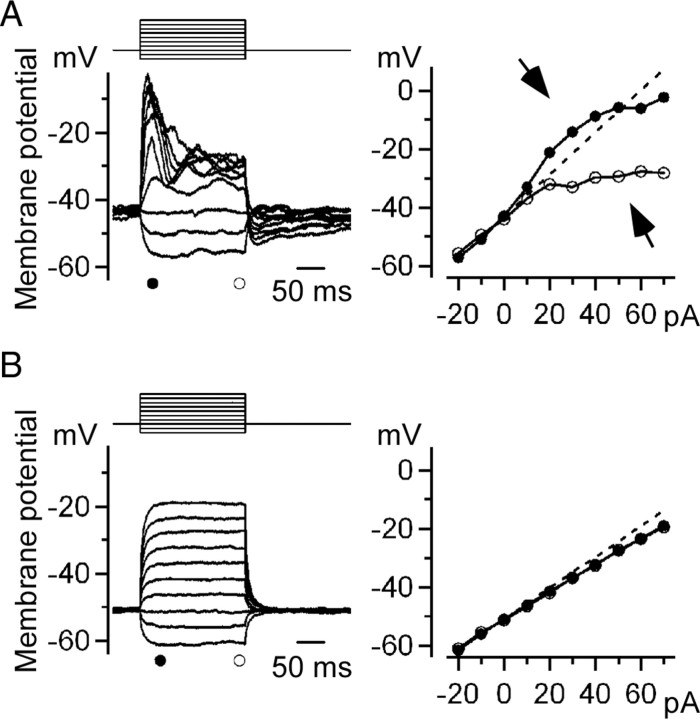
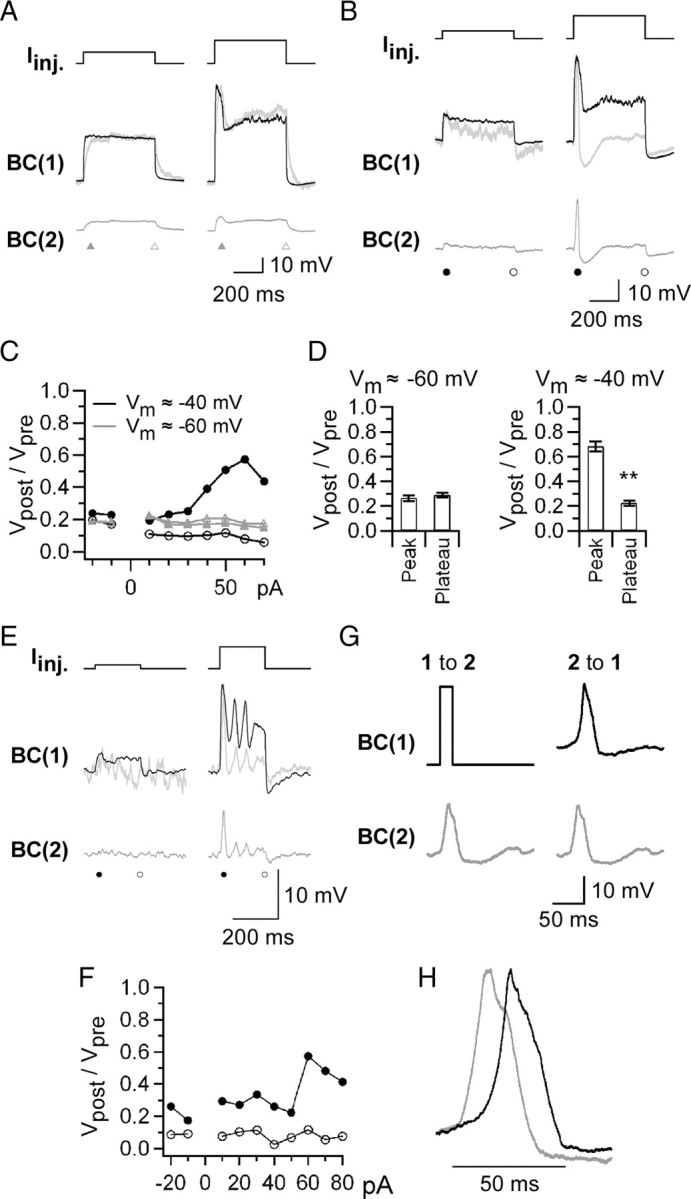
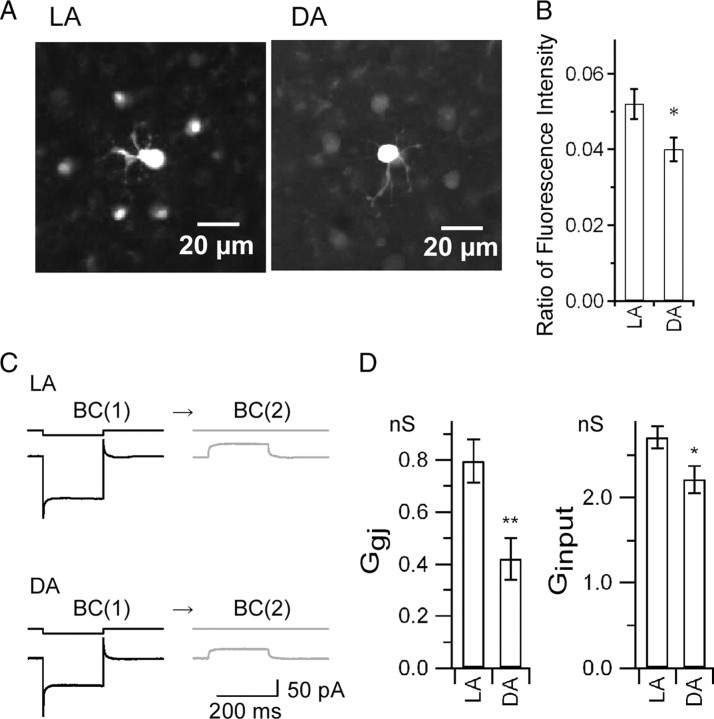
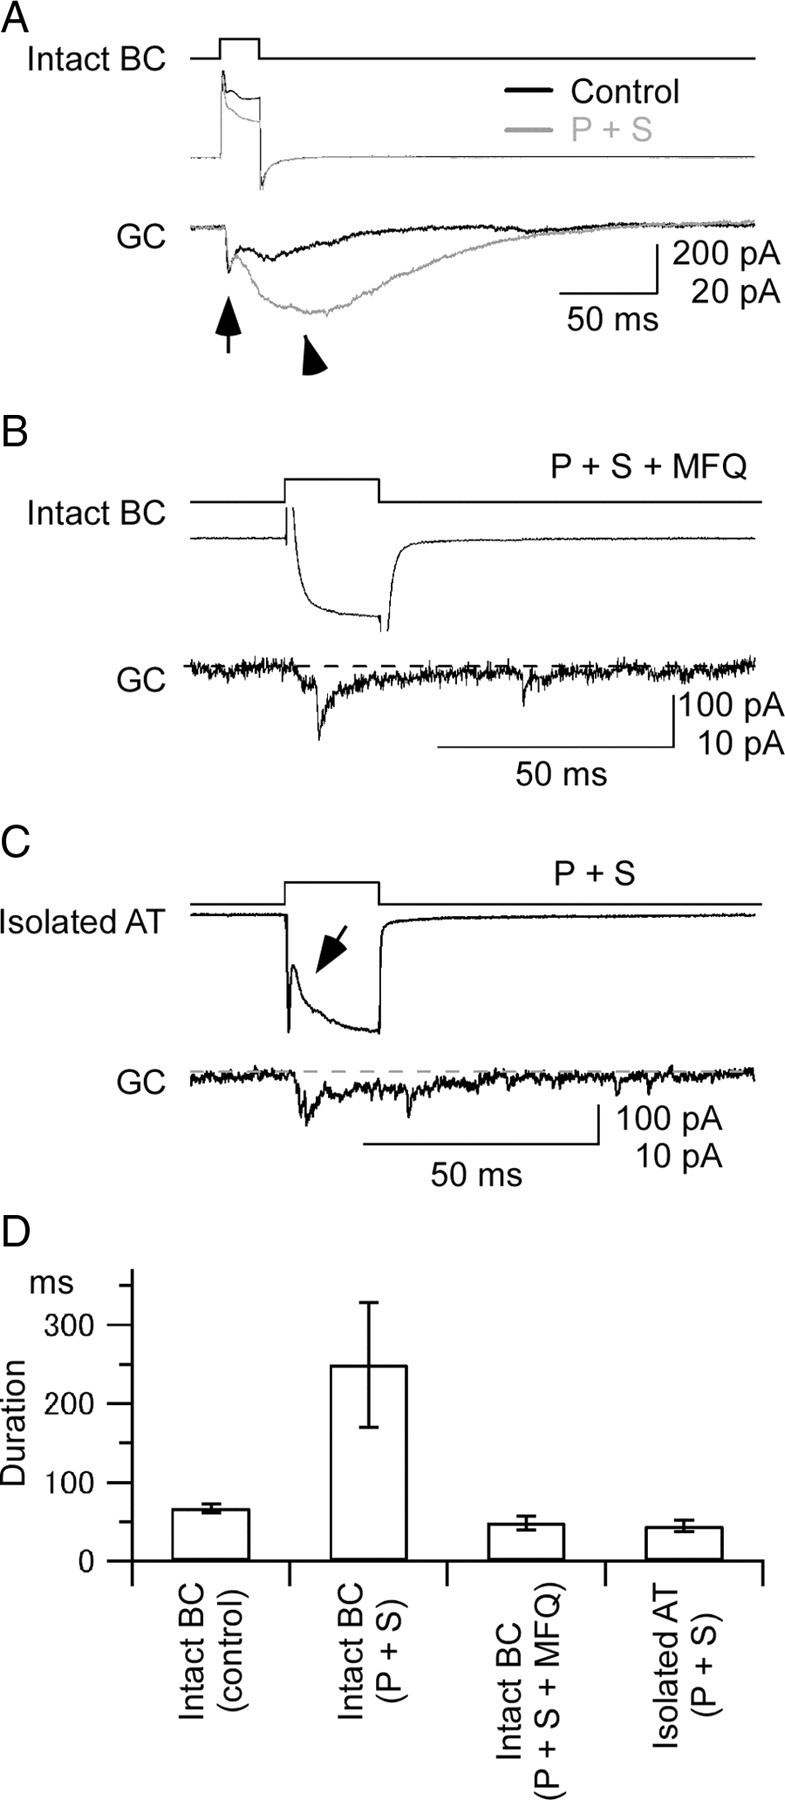
Gap junctions are frequently observed in the adult vertebrate retina. It has been shown that gap junctions function as passive electrotonic pathways and play various roles, such as noise reduction, synchronization of electrical activities, regulation of the receptive field size, and transmission of rod signals to cone pathways. The presence of gap junctions between bipolar cells has been reported in various species but their functions are not known. In the present study, we applied dual whole-cell clamp techniques to the adult goldfish retina to elucidate the functions of gap junctions between ON-type bipolar cells with a giant axon terminal (Mb1-BCs). Electrophysiological and immunohistochemical experiments revealed that Mb1-BCs were coupled with each other through gap junctions that were located at the distal dendrites. The coupling conductance between Mb1-BCs under light-adapted conditions was larger than that under dark-adapted conditions. The gap junctions showed neither rectification nor voltage dependence, and behaved as a low-pass filter. Mb1-BCs could generate Ca(2+) spikes in response to depolarization, especially under dark-adapted conditions. The Ca(2+) spike evoked electrotonic depolarization through gap junctions in neighboring Mb1-BCs, and the depolarization in turn could trigger Ca(2+) spikes with a time lag. A brief depolarizing pulse applied to an Mb1-BC evoked a long-lasting EPSC in the postsynaptic ganglion cell. The EPSC was shortened in duration when gap junctions were pharmacologically or mechanically impaired. These results suggest that the spread of Ca(2+) spikes through gap junctions between bipolar cells may play a key role in lateral interactions in the adult retina.


Figures

Figure 1.
Figure 1.
Electrical coupling between Mb1-BCs. A, Tracer coupling among Mb1-BCs. Neurobiotin was introduced through a recording pipette into the axon terminal of an Mb1-BC in the light-adapted, whole-mount preparation. After fixation, Neurobiotin was visualized by streptavidin-conjugated Alexa488, and then the preparation was observed under confocal microscope. The focal plane was at the level of the INL (left) and at the IPL (right). B, Fluorescence micrograph of two neighboring intact Mb1-BCs in the slice preparation. Each cell was filled with Lucifer yellow through a recording pipette. C, Recordings from a neighboring pair of intact Mb1-BCs [BC(1) and BC(2): different from B] in the light-adapted retina. Both cells were voltage clamped at −60 mV. Hyperpolarization (to −100 mV for 200 ms) of one cell of the pair evoked a transjunctional outward current in the other. The control external solution and the Cs+-based pipette solution were used. D, Recordings from the same pair shown in C after >30 min treatment with MFQ (10 μm). E, Fluorescence micrograph. 1, An isolated giant axon terminal of Mb1-BC [AT(1)]. 2, An intact Mb1-BC [BC(2)]. F, Recordings from the pair of AT(1) and BC(2) shown in E. Both were voltage clamped at −60 mV. Hyperpolarization (to −100 mV for 200 ms) of one cell of the pair did not evoke any response in the other cell. The control external solution and the K+-based pipette solution were used. The traces shown are from the dark-adapted condition. G, Fluorescence micrograph. 1, A truncated Mb1-BC without axon terminal [TC(1)]. 2, An intact Mb1-BC [BC(2)]. H, Recordings from the pair of TC(1) and BC(2) shown in G. Both were voltage clamped at −60 mV. Hyperpolarization (to −100 mV for 200 ms) of one cell of the pair evoked a transjunctional outward current in the other cell. The control external solution and the K+-based pipette solution were used. The traces shown are from the dark-adapted condition.
Figure 2.
Figure 2.
Properties of gap junctions. A–C, Voltage dependence and rectification of the gap junction conductance. A, Recordings from a pair of intact Mb1-BCs in the light-adapted slice preparation. Both cells were voltage clamped at −60 mV. Voltage steps (10 mV increment from −100 to +90 mV for 200 ms) were applied to one cell of the pair and the currents were recorded from both cells. The Co2+ extracellular solution and the Cs+-based pipette solution were used. B, IgjVdif relations obtained from A. The amplitude of the transjunctional current (Igj) was plotted against the voltage difference (Vdif) between paired cells. C, Pooled data of the gap junction conductance Ggj (n = 16 pairs). Ggj was calculated from the slope of IgjVdif relations as shown in B. Raw (black) and averaged (gray) data are shown. D, E, Temporal filtering property of the gap junctions. D, Examples of voltage responses evoked by sinusoidal current injection (Iinj: peak-to-peak 20 pA) at various frequencies. Responses from presynaptic (Pre; black) and postsynaptic (Post; gray) cells under current clamp were superimposed. The Co2+ extracellular solution and the Cs+-based pipette solution were used. The traces shown are from the light-adapted condition. E, Coupling ratio and phase shift. Each symbol represents the mean ± SEM (n = 4–5 pairs).
Figure 3.
Figure 3.
Ca2+ spikes generated by current injection. A, Left, Membrane potential changes induced by current injection. A series of current pulses (10 pA increment from −20 to +70 pA for 200 ms) was injected into a current-clamped Mb1-BC in the dark-adapted retina. The control external solution and the K+-based pipette solution were used. Right, V–I relations obtained from the left panel. The amplitude of the peak (filled circles) and plateau (open circles) potentials were plotted against the intensity of the injected current. The straight line was extrapolated from the relation between the hyperpolarizing currents and the responses (broken line). Deviation from the straight line was observed for large current injection (arrows). B, Membrane potential changes induced by current injection in the presence of Co2+. Data were obtained from the same cell shown in A.
Figure 4.
Figure 4.
Spread of Ca2+ spikes through gap junctions. Recordings were performed from a pair of Mb1-BCs in the dark-adapted retina. A, Passive spread. The membrane potential (Vm) of both BC(1) and BC(2) was held around −60 mV by injection of a steady hyperpolarizing current. Then, the current pulse (top; left 50 pA, right 100 pA) was injected into the BC(1), and the membrane potential was recorded from the BC(1) (middle, black) and the BC(2) (bottom, gray). The normalized BC(2) response (middle, gray) is superimposed on the BC(1) response (middle, black). The control external solution and the K+-based pipette solution were used. B, Active spread. Recordings were made from the same pair as in A, but Vm was held around −40 mV. The current pulse intensity was 20 (left) and 60 (right) pA. C, Ratio of transmission. The amplitude ratio of the BC(2) response (Vpost) to the BC(1) response (Vpre) was calculated at the peak and the plateau, and was plotted against the current pulse intensity. Vm ≈ −60 mV (gray): peak, filled triangle; plateau, open triangle. Vm ≈ −40 mV (black): peak, filled circle; plateau, open circle. D, Pooled data of the ratio of transmission. **p < 0.01, paired t test, n = 9 pairs (Vm ≈ −60 mV) and 21 pairs (Vm ≈ −40 mV). E, Long-distance spread of Ca2+ spikes. Current injection experiment (same protocol as in B) was performed from a pair of Mb1-BCs, between which one Mb1-BC intervened. Top, Injected current pulses (left, 10 pA; right, 60 pA). Middle, The BC(1) responses (black) and the normalized BC(2) responses (gray). Bottom, The BC(2) responses. F, Ratio of transmission. The amplitude ratio (Vpost/Vpre) was calculated from the data exemplified in E and plotted against the current pulse intensity. Peak, Solid circle; plateau, open circle. G, Transmission ratio. Left, The brief depolarizing pulse (from −40 to −10 mV for 20 ms) applied to the voltage-clamped BC(1) evoked a Ca2+ spike in the current-clamped BC(2). Vm of the BC(2) was approximately −40 mV. Right, Application of the template of the recorded Ca2+ spike (gray) to the voltage-clamped BC(2) resulted in generation of a Ca2+ spike (black) in the current-clamped BC(1). The control external solution and the K+-based pipette solution were used. H, Superimposed Ca2+ spikes shown in G right after normalization.
Figure 5.
Figure 5.
Effects of light adaptation. A, B, Tracer coupling. A, Fluorescence images of tracer coupling among Mb1-BCs. Neurobiotin was introduced through a recording pipette into the axon terminal of a single Mb1-BC in the LA (left) or DA (right) whole-mount preparation. Focus was at the level of inner nuclear layer. B, Ratio of the fluorescence intensity, defined by the equation (FsFback)/(FcFback), where Fs, Fc, and Fback are the averaged intensity of the surrounding somata, the intensity of the tracer-injected soma, and the averaged intensity of the background, respectively. LA, n = 11 (data from 39 surrounding somata and 11 injected somata). DA, n = 8 (data from 37 surrounding somata and 8 injected somata). p < 0.05, unpaired t test. C, D, Electrical coupling under LA and DA conditions. C, Hyperpolarizing voltage pulse from −60 to −100 mV was applied to the BC(1) and the current responses were recorded from the BC(1) and the BC(2) in the slice preparation. D, Left, Pooled data of Ggj. LA, 0.80 ± 0.084 nS (n = 16). DA, 0.42 ± 0.081 nS (n = 9). p < 0.01, unpaired t test. Right, Pooled data of Ginput. Ginput was obtained from the current response of the BC(1) to hyperpolarizing voltage pulse from −60 to −100 mV. LA, 2.7 ± 0.13 nS (n = 18). DA, 2.2 ± 0.16 nS (n = 32). p < 0.05, unpaired t test.
Figure 6.
Figure 6.
Synaptic transmission from Mb1-BC to GC. A, Long-lasting EPSC evoked by a brief depolarization of Mb1-BC. Paired recordings from an intact Mb1-BC (intact BC) and a postsynaptic ganglion cell (GC) in the dark-adapted retina. A depolarizing pulse (from −60 to −10 mV for 20 ms) (top) applied to the intact BC evoked an outward current (middle) in the intact BC and an EPSC (bottom) in the GC voltage clamped at −60 mV. Recordings were performed in the control solution (Control, black traces), and then in the presence of picrotoxin (200 μm) and strychnine (10 μm) (P + S, gray traces). The pipette for the intact BC was filled with the Cs+-based pipette solution and that for GC with the Cs+-based pipette solution containing QX-314 (5 mm). The evoked EPSC consisted of the fast (arrow) and slow (arrowhead) components. B, Effects of a gap junction blocker on the synaptic transmission from Mb1-BC to GC. Recordings were made from a pair of an intact BC and a postsynaptic GC in the dark-adapted retinal slice preparation, which was preincubated for >30 min with MFQ (10 μm), picrotoxin (200 μm), strychnine (10 μm), and L-AP4 (100 μm). The pipette for the intact BC was filled with the Cs+-based pipette solution and that for the GC with the Cs+-based pipette solution containing QX-314 (5 mm). A brief depolarization (top; from −60 to −10 mV for 50 ms) of the intact BC evoked a Ca2+ current (middle) in the intact BC and a transient EPSC (bottom) in the GC. The dotted line indicates the basal current at the holding potential of −60 mV. C, Recordings from a pair of an isolated axon terminal (isolated AT) of Mb1-BC and a postsynaptic GC in the dark-adapted retina. Both were voltage clamped at −60 mV. A brief depolarization (top; to −10 mV for 20 ms) of the isolated AT evoked a Ca2+ current (middle) in the isolated AT and an EPSC (bottom) in the GC. The arrow indicates the proton feedback. The dotted line indicates the basal current at the holding potential of −60 mV. The external solution contained picrotoxin (200 μm), strychnine (10 μm), and TTX (0.5 μm), and the Cs+-based pipette solution. D, Pooled data of duration of the EPSCs evoked in the postsynaptic GCs. Duration was defined as the response width of 10% of the peak amplitude. Data were obtained from five pairs of an intact BC and a GC in control condition [Intact BC (control)], five pairs of an intact BC and a GC in the solution containing picrotoxin and strychnine [Intact BC (P + S)], five pairs of an intact BC and a GC in the solution containing picrotoxin, strychnine, and mefloquine [Intact BC (P + S + MFQ)], and three pairs of an isolated AT and a GC in the solution containing picrotoxin and strychnine [Isolated AT (P + S)].

References

    1. Ackert JM, Wu SH, Lee JC, Abrams J, Hu EH, Perlman I, Bloomfield SA. Light-induced changes in spike synchronization between coupled ON direction selective ganglion cells in the mammalian retina. J Neurosci. 2006;26:4206–4215. - PMC - PubMed
    1. Alev C, Urschel S, Sonntag S, Zoidl G, Fort AG, Höher T, Matsubara M, Willecke K, Spray DC, Dermietzel R. The neuronal connexin36 interacts with and is phosphorylated by CaMKII in a way similar to CaMKII interaction with glutamate receptors. Proc Natl Acad Sci U S A. 2008;105:20964–20969. - PMC - PubMed
    1. Arai I, Yamada Y, Asaka T, Tachibana M. Light-evoked oscillatory discharges in retinal ganglion cells are generated by rhythmic synaptic inputs. J Neurophysiol. 2004;92:715–725. - PubMed
    1. Bloomfield SA, Völgyi B. The diverse functional roles and regulation of neuronal gap junctions in the retina. Nat Rev Neurosci. 2009;10:495–506. - PMC - PubMed
    1. Bloomfield SA, Xin D, Persky SE. A comparison of receptive field and tracer coupling size of horizontal cells in the rabbit retina. Vis Neurosci. 1995;12:985–999. - PubMed

Publication types

MeSH terms

LinkOut - more resources